 Usman Salis

⬤ Bitcoin is taking a breather after stepping back from its recent all-time high, settling into a consolidation pattern following a textbook corrective move. While there's no clear signal yet that the bulls are ready to charge back in, several technical indicators and market dynamics are starting to line up as BTC holds steady within a crucial price zone on the daily chart.
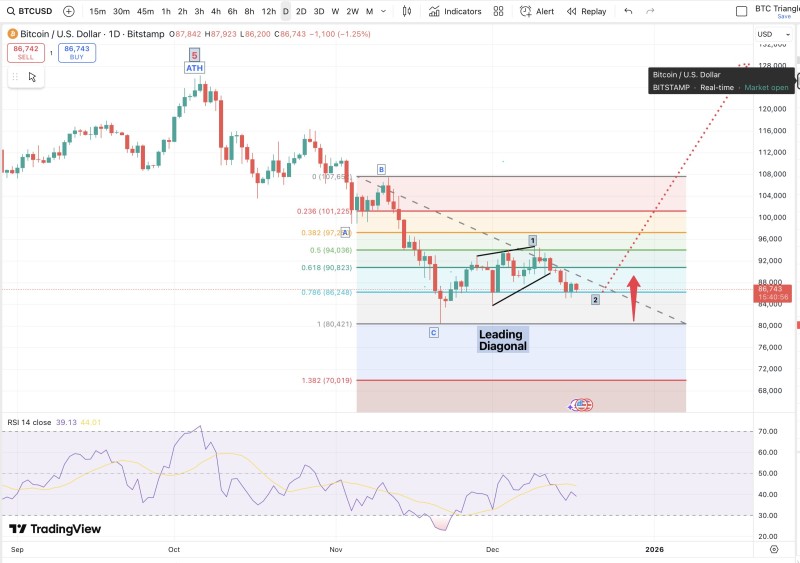
⬤ The technical picture shows a clean ABC correction playing out from Bitcoin's peak, with wave C matching wave A in length—the most typical corrective pattern traders look for. Price has pulled back into a key Fibonacci zone, finding support somewhere between the 0.618 and 0.786 retracement levels. The decline has been orderly rather than chaotic, maintaining structure above the deeper support levels near $80,000, which keeps the bigger uptrend story intact.
⬤ Beyond the charts, the market backdrop is getting more interesting. Bitcoin ETF flows have flipped positive again, offering some fundamental support while the spot price consolidates. On the momentum front, the daily RSI is still quiet, but the setup is primed—one more slight dip in price would trigger a regular bullish divergence, signaling that selling pressure is running out of steam even as price remains contained.
⬤ This matters because Bitcoin still calls the shots for the entire crypto market. With a completed correction pattern, healthier ETF flows, and a potential momentum divergence brewing, BTC is sitting at a crossroads. How price behaves in this range over the coming days will likely set the tone for near-term sentiment across digital assets and determine whether the market can shift from correction mode back into an uptrend.
 Usman Salis


