 Saad Ullah

⬤ Bitcoin dominance has started pulling back after peaking above 60%, and traders are now watching the 49% level as a potential turning point. The weekly chart shows a clear topping pattern forming after a multi-year uptrend that kicked off in 2022. Right now, dominance sits around 59%, with technical projections pointing toward that 49% support zone as the next major test.
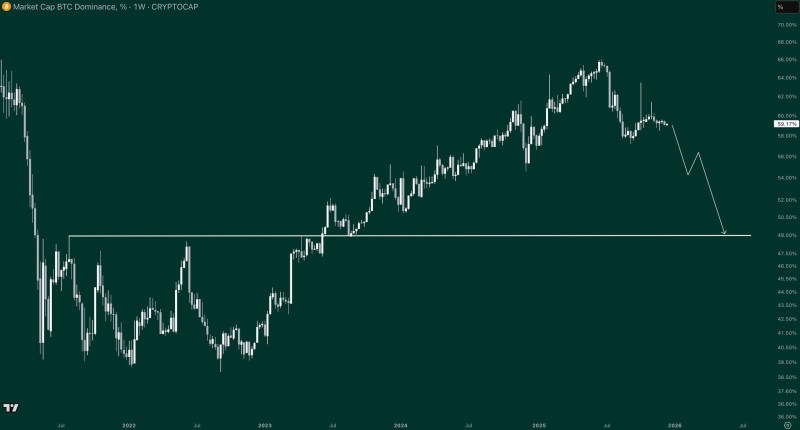
⬤ What makes this interesting is that the decline looks controlled rather than chaotic. The chart shows a gradual slide rather than a sharp drop, suggesting capital is slowly rotating rather than rushing for the exits. Bitcoin dominance has been a reliable macro indicator for how concentrated the market is—when it falls, it usually means money is spreading out across other digital assets instead of piling into Bitcoin alone.
⬤ The 49% level matters because it's marked as historically significant support where market behavior has shifted before. If dominance stabilizes there, it could mark the beginning of a new phase in the crypto cycle. If it breaks lower, that would signal even broader participation across the market. Either way, this zone is becoming a focal point for anyone trying to read where the next wave of market leadership is heading.
 Saad Ullah


