 Marina Lyubimova
Binance Coin (BNB) gained 0.15% yesterday, and now traders are watching to see if it can push through a crucial resistance that could spark more gains.
Binance Coin (BNB) is having a pretty decent run lately, picking up 0.15% since yesterday. It's not exactly moon territory, but hey - in crypto, slow and steady sometimes wins the race. Right now, all eyes are on some key price levels that could decide where BNB heads next.
The thing is, BNB isn't just any random altcoin. It's the native token of Binance, the world's biggest crypto exchange, so when it moves, people pay attention. And right now, the charts are telling an interesting story about what might happen next.
BNB Hourly Chart Shows Breakout Could Be Coming Soon
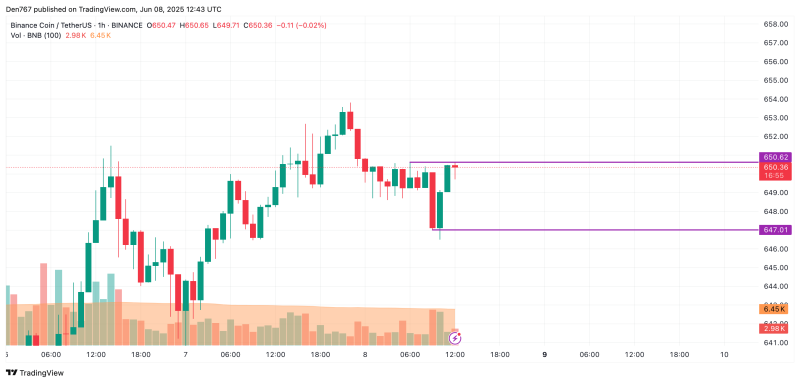
Looking at the hourly chart, BNB is sitting right underneath a resistance level at $650.62. Think of this like a ceiling that the price keeps bumping its head against. But here's the interesting part - it looks like BNB might finally be ready to break through.
If that happens, we could see the price shoot up to around $655 pretty quickly. That's not a huge move in crypto terms, but it's significant enough to get traders excited. The key thing to watch is whether there's enough buying pressure to actually push through that resistance and stay above it.
You know how it goes in crypto - sometimes you get these fake breakouts where the price pops above resistance for a hot minute, then comes crashing back down. That's why traders want to see some real conviction behind any move higher.
Daily Chart Paints Even Rosier Picture for BNB
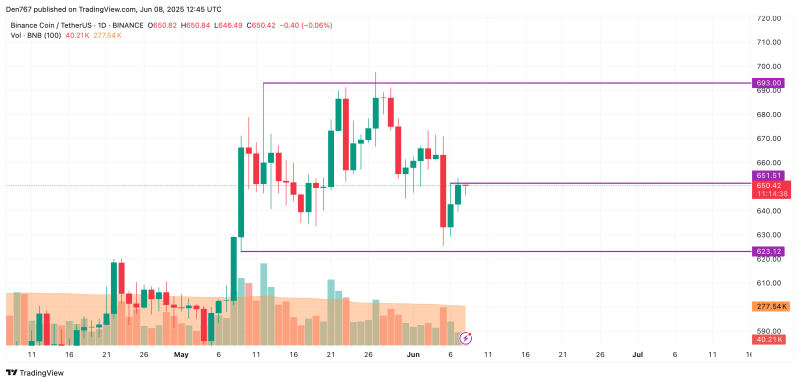
When you zoom out to the daily chart, things look even better for Binance Coin (BNB). There's another important level at $651.51, and if the daily candle closes above that, we could be looking at a move toward $660-$670 next week.
Now, that might not sound like much - we're talking about maybe 1.5% to 3% gains here. But in the current market environment, steady gains like that are actually pretty solid. Plus, if BNB can establish itself above these levels, it sets up nicely for potentially bigger moves down the road.
The $660-$670 zone is particularly interesting because it lines up with some previous support and resistance areas. In technical analysis, when old resistance becomes new support (or vice versa), it tends to be pretty reliable. So if BNB gets up there, it might actually stick around for a while.
Midterm Outlook for BNB: Don't Expect Fireworks Just Yet
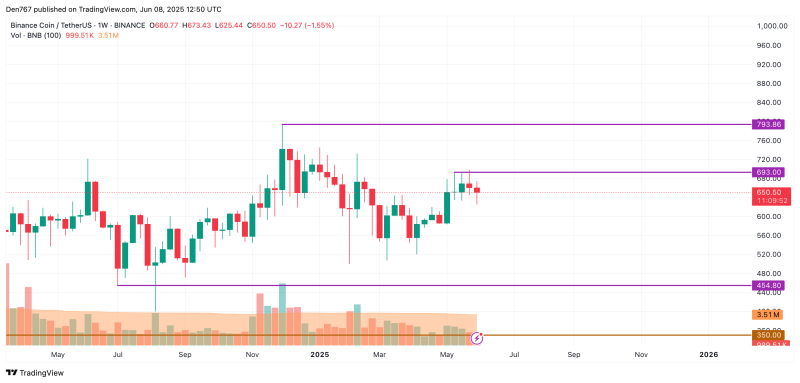
Here's where things get a bit more realistic. While the short-term charts look pretty bullish for Binance Coin (BNB), the bigger picture suggests we shouldn't expect any dramatic moves anytime soon.
Right now, BNB is kind of stuck in no man's land. It's not close enough to major support levels to trigger a big bounce, and it's not near major resistance that would cause a selloff. It's just... floating in the middle. And when that happens, crypto tends to move sideways for a while.
This isn't necessarily bad news. Sometimes consolidation phases like this are exactly what an asset needs to build up energy for the next big move. It's like a coiled spring - the longer it stays compressed, the bigger the eventual release might be.
But for traders looking for quick action, this might be a bit frustrating. The good news is that BNB's current position gives it room to move in either direction once the market decides which way it wants to go.
At the time of writing, Binance Coin (BNB) is trading at $650.50. That puts it right in the sweet spot where it could either break higher through those resistance levels we talked about, or settle back into a longer consolidation phase.
The bottom line? BNB looks decent in the short term, with some clear targets to watch. But don't expect any massive moves unless something major happens in the broader crypto market. Sometimes the most profitable trades are the boring ones that just slowly grind higher over time.
 Marina Lyubimova


