 Usman Salis

⬤ Cardano (ADA) is holding a bullish structure on the 4-hour chart, printing higher highs and higher lows even as Bitcoin continues making lower lows and lower highs. This divergence shows ADA has short-term relative strength that goes against the typical correlation with BTC during periods of market weakness.
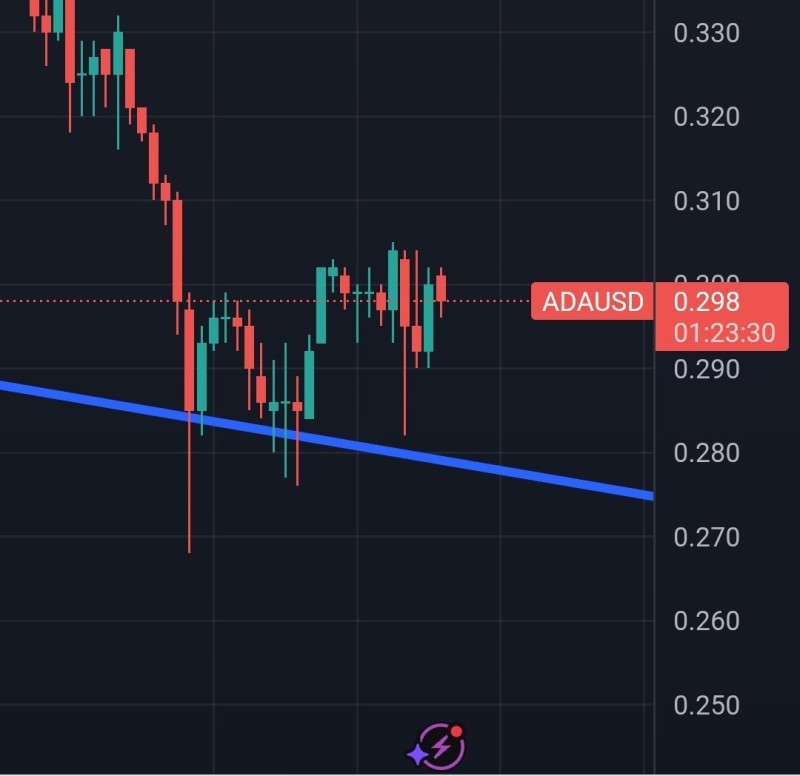
⬤ The ADA/USD chart shows price staying supported around $0.29–$0.30, respecting an upward trend line that's been guiding recent moves. Each dip gets bought at higher levels, showing demand is holding up. This matches the higher-low pattern and suggests ADA isn't following Bitcoin's current weakness on shorter timeframes.
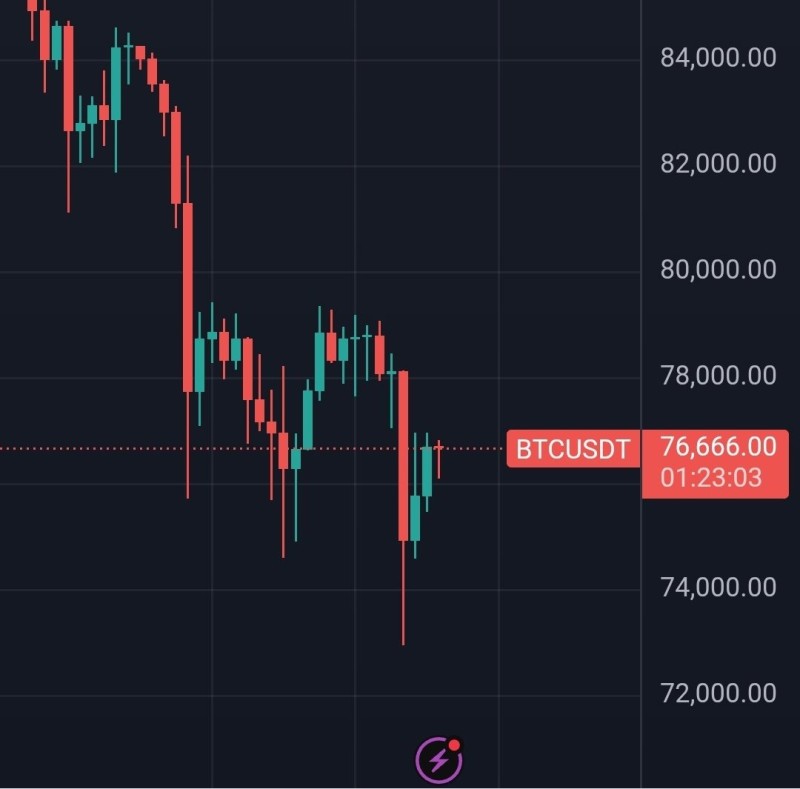
⬤ Meanwhile, Bitcoin's chart tells a different story. BTC/USDT keeps making lower highs and lower lows after failing to hold rebounds. Recent candles show rejection from consolidation areas, confirming the short-term bearish setup. Since BTC usually leads the market on lower timeframes, this contrast makes the divergence worth watching.
⬤ Relative strength during market stress often points to selective positioning and changing sentiment. While this doesn't confirm any major trend reversal, ADA holding a bullish pattern while Bitcoin trends down shows the market is becoming less uniform. This kind of behavior can affect near-term volatility and shows why tracking individual asset structures matters more than just watching Bitcoin alone.
 Usman Salis


