 Marina Lyubimova

⬤ ADA is showing early signs of life after a brutal downtrend, with price consolidating above recent lows. The weekly ADA/USDT chart shows Cardano trading around $0.37 to $0.38 after bouncing from a low near $0.27. According to @CryptoGVR, the $0.25 to $0.40 range is being watched as a potential reversal zone where selling pressure might finally start to ease up.
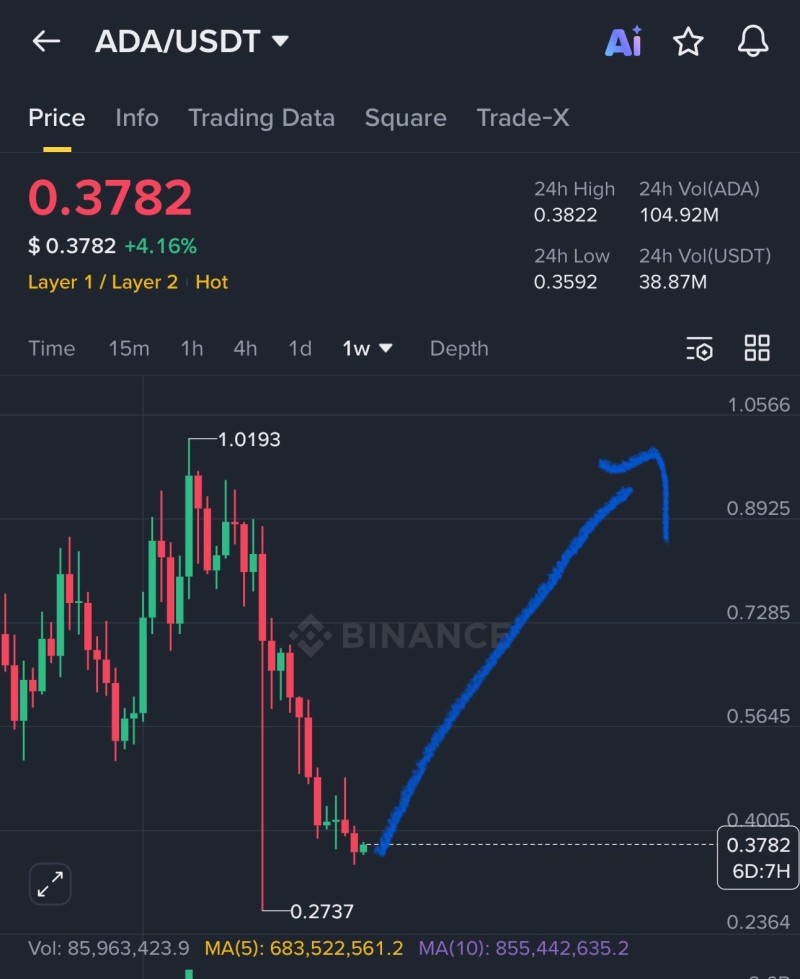
⬤ The chart tells a story of a sharp fall from grace—ADA previously hit a high close to $1.02 before entering a sustained bearish phase that accelerated downward. That move resulted in a quick drop toward the $0.27 level, followed by stabilization and a modest recovery. The projected price path on the chart suggests a gradual climb from current levels, hinting at a possible shift away from the previous bearish structure.
⬤ At the time of the snapshot, ADA was trading at approximately $0.378, reflecting a daily gain of over 4%. Trading activity looks steady, with price holding within the highlighted accumulation zone. The long-term scenario outlined points to a potential recovery toward the $1.00 to $1.20 range if ADA can maintain its base and keep building momentum over time.
⬤ This matters because ADA has historically formed extended bases after deep corrections. A sustained recovery from the current range could shift sentiment across the broader Layer 1 sector and signal improving market conditions. That said, the chart makes it clear that any upward move will likely unfold gradually—price needs to establish strength across multiple levels before a broader trend shift becomes obvious.
 Marina Lyubimova


