Alex Dudov

⬤ Bitcoin is at a pivotal crossroads. Traders are weighing two opposing paths following BTC's recent pullback. The chart shows an ABC corrective structure, with key Fibonacci zones framing both scenarios.
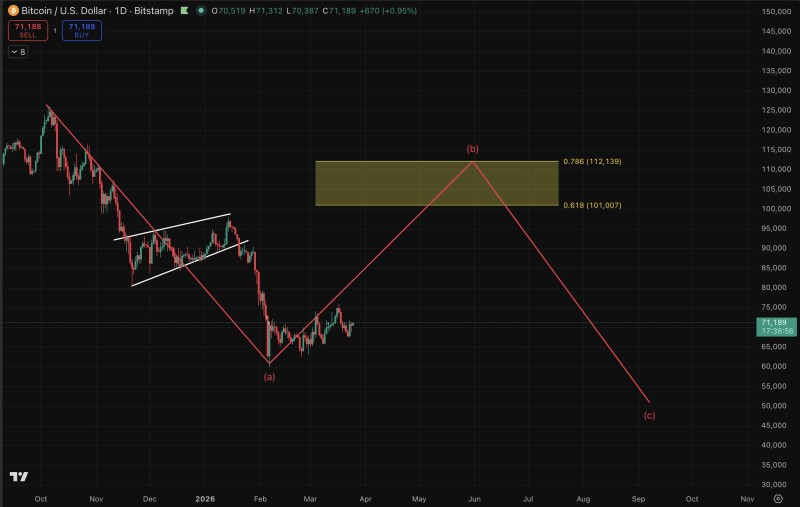
⬤ In the first scenario, BTC could push toward the $100,000-$110,000 range, aligning with the 0.618-0.786 Fibonacci retracement levels. This area marks a likely B-wave peak before a deeper leg down. Under this path, Bitcoin could eventually revisit the $40,000-$50,000 zone as the broader correction plays out.
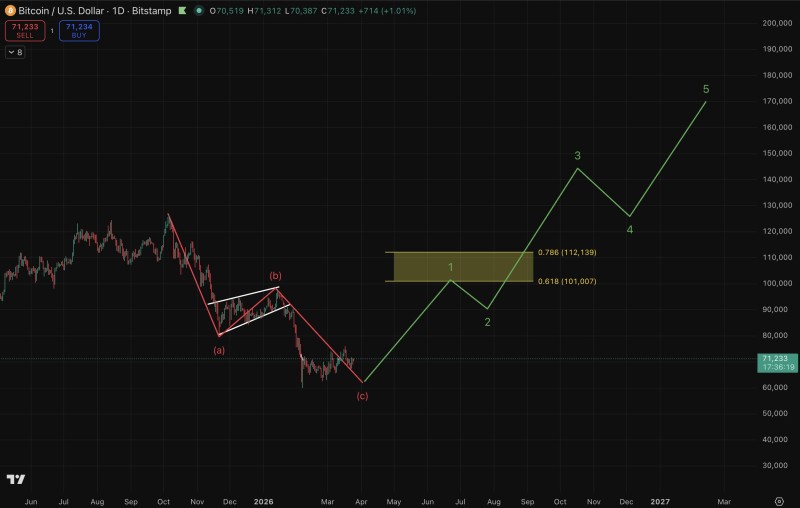
⬤ The second scenario skips the $100K bounce entirely. Instead, BTC corrects directly to the $60,000 region, where an impulsive rally could begin. From that base, the structure points toward a fresh attempt at all-time highs, bypassing the extended B-wave recovery altogether.
⬤ Both paths converge on one theme: $60,000 is a critical floor. As noted in analysis around the BTC monthly close near $73K, losing key support opens the door to corrections toward $50K. How price reacts at current levels will determine the dominant trend for months ahead.
⬤ The $100,000-$110,000 band stands as the defining resistance zone regardless of which scenario unfolds. A reaction there - either a strong rejection or a clean breakout - will clarify whether this cycle's uptrend is still intact or giving way to a longer consolidation.
 Alex Dudov