Usman Salis

WTI crude was trading near $94.75 after a 4.07% decline, with the session range printing a high of $98.80 and a low of $93.23. Crypto and markets analyst CyrilXBT argued that this kind of sudden collapse matters beyond energy, because oil often reflects how traders see the broader economic backdrop. When crude moves this fast and this far, markets may be reassessing growth, consumption, and risk appetite all at once.
The WTI Candle That Broke Market Structure
Before the plunge, WTI crude had been trading in a choppy but elevated range, with several failed pushes near the $116 area followed by a sequence of lower highs. What had looked like resilience at higher levels gradually turned into weakness. Once sellers regained control, price began moving down with little evidence of meaningful support.
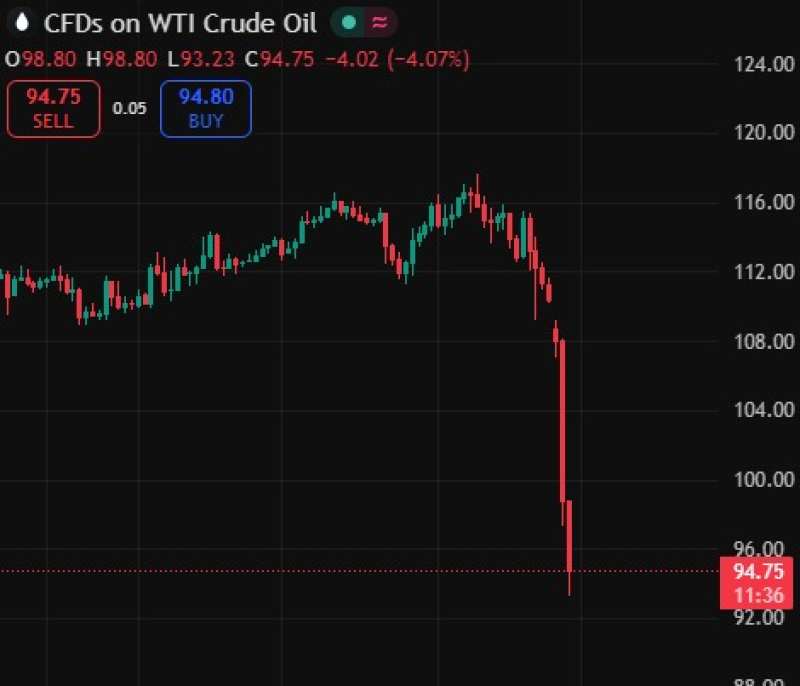
The final leg lower is what changed the picture entirely. Price did not drift into the mid-$90s — it dropped almost vertically. That kind of candle usually signals urgency: bids are pulled and sellers dominate the tape in a compressed window of time. WTI's move also fits the broader energy-market volatility seen in recent coverage, including WTI Oil Price Analysis: Crude Crashes 14% in Minutes on Iran News.
When WTI Oil's $100 Level Stops Acting Like a Floor
One of the clearest technical signals on the chart is the clean break below $100. Round-number levels often act as psychological support, but here the market moved through that zone without any visible stabilization. That failure makes the selloff feel more aggressive — buyers were either absent or quickly overwhelmed.
The drop was abrupt, directional, and tied to a broad repricing in expectations rather than a slow technical unwind.
The chart also offers no confirmed base yet near $94.75. There is a low print at $93.23, but the structure still looks unresolved rather than repaired. Until crude starts forming a steadier reaction zone, the price action remains tilted to the downside. Related context on failed WTI recoveries can be found in WTI Oil Struggles at $65.39 After Failed Breakout - 0.5% Drop.
Why WTI's 4% Drop Reaches Beyond Oil Markets
The drop was abrupt, directional, and tied to a broad repricing in expectations rather than a slow technical unwind. That makes the message straightforward. This is also why the move matters for assets outside commodities. If oil is suddenly pricing softer economic activity, the pressure can spill into other risk markets that depend on improving sentiment to sustain upside momentum.
For now, the chart is not showing panic exhaustion. It is showing a market that repriced lower in a hurry — and that is usually a signal traders do not ignore. For additional context on what extended crude weakness looks like, see Crude Oil Slumps to 5-Month Low Amid Renewed Market Pressure.
The structure still looks unresolved rather than repaired. Until crude forms a steadier reaction zone, price action remains tilted to the downside.
Key levels to watch:
- Session high: $98.80
- Pre-drop range: near $116 area (multiple failed pushes)
- Key psychological level broken: $100
- Current price: $94.75
- Session low: $93.23
 Usman Salis