 Eseandre Mordi

⬤ WTI crude oil is sitting at a genuinely critical spot on the long-term chart. The focus right now should be on watching for a confirmed breakout rather than retelling past price stories. The historical chart tells a clear story: every time crude oil pushed through a major resistance level after a long consolidation, what followed was not a modest rally but a structural shift in pricing.
⬤ Decades of WTI price history show a repeating pattern. After long periods of compression, oil broke out and then moved threefold, fourfold, and in the most extreme cases more than tenfold beyond prior ranges. These were not short spikes, they were extended trend regimes that played out over years. The current price action around mid-range levels sits under a descending resistance band that has capped every rally since the previous peaks, and that band is being tested again right now.
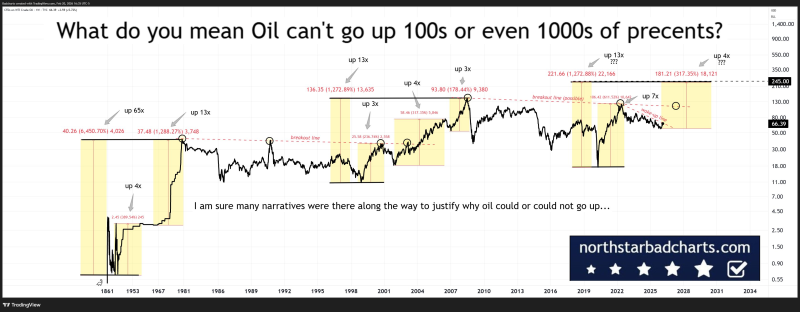
⬤ Price compression like this often resolves with a decisive break in one direction. Technically, congestion under a long-term descending trendline is exactly the kind of structure that, when broken, tends to produce sustained moves. WTI crude oil has already been under pressure, oscillating near key support and resistance without committing to a direction. That kind of sideways action can look boring until it suddenly is not.
⬤ The implications of a confirmed breakout go well beyond the energy sector. Crude oil prices feed directly into inflation expectations, production costs, and commodity market sentiment. A shift above entrenched resistance could reshape macroeconomic narratives tied to energy, affecting equities and broader risk appetite. Looking back at major milestones in oil price history, each structural breakout came with broader market consequences that few anticipated in advance. That history is exactly why this setup deserves close attention.
 Eseandre Mordi


