 Marina Lyubimova

⬤ WTI crude is sitting right at a major technical crossroads. On the monthly chart, oil has been carving out a bull flag inside a massive falling wedge that stretches all the way back to the 2008 highs. Right now, price is hovering around the mid-$60 range — squeezing tighter under descending resistance while still holding comfortably above the bottom of that long-term structure.
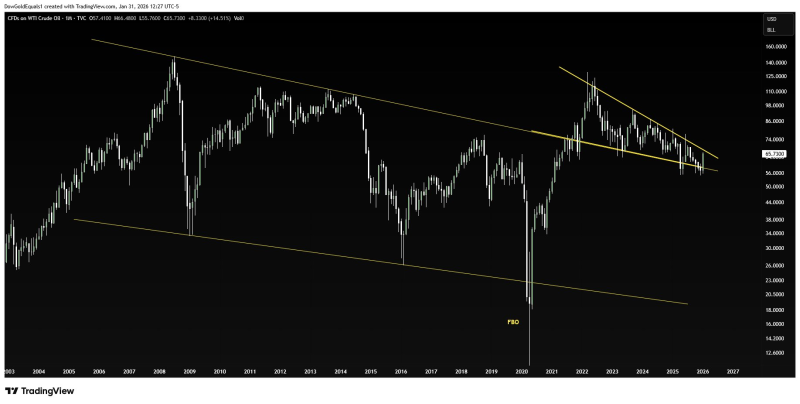
⬤ The falling wedge itself tells an interesting story. It's defined by a series of lower highs since 2008 on top and gradually rising lows on the bottom. After the brutal crash in 2020, crude recovered hard and has stayed within this channel ever since — not breaking out, but not falling apart either. That kind of sideways-to-lower action inside a tightening wedge usually means the market is loading up for a big move in one direction.
⬤ The bull flag showing up in the more recent part of the chart is worth paying attention to. After the strong run into the 2022 highs, price pulled back and started moving sideways — classic flag behavior. The key point here is that it hasn't cracked below major support during this consolidation, which suggests bulls are still in the game even as the wedge keeps compressing.
⬤ Why does this matter beyond the chart? Crude oil is one of the biggest drivers of global inflation. If WTI breaks out of this wedge to the upside, it would be a structural shift we haven't seen in over a decade — and it could fan the flames on inflation pressures already showing up in metals. On the flip side, if price stays trapped, we're looking at more of the same prolonged consolidation. Either way, as oil approaches the apex of this pattern, the next leg is likely to ripple across energy and broader macro markets.
 Marina Lyubimova


