Alex Dudov
Silver is extending its recovery from the 74 region, with price now pressing into the 76.5–77 zone after forming a clear sequence of higher lows and a higher high. Analyst Forex Sinyal Merkezi flagged this recovery as a textbook transition into a higher low + higher high formation, with momentum accelerating directly into resistance. The latest move highlights sustained bullish pressure, but also brings the market into a near-term resistance test where how price reacts becomes critical.
The Silver Structure That Turned Bullish
The chart shows a clean transition from a lower-range base into an upward structure. After stabilizing around 73–74, price began forming higher lows, eventually breaking above the mid-range area near 75.3–75.5 and accelerating higher.
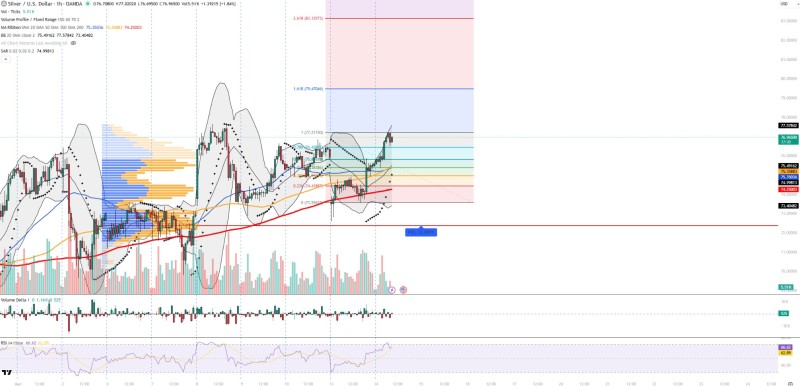
This shift confirms a short-term uptrend, with price holding above key moving averages and maintaining structure. The move toward 76.5–77 represents the strongest leg of the current cycle, pushing price toward the upper boundary of recent price action. Silver Holds Trendline After Bounce From $74–$75 Support reinforced just how important that base has been in anchoring the current move.
Silver Momentum Signals Stay Strong at 66–67 RSI – but Stretched
Indicators on the chart align closely with the current price behavior. Momentum remains clearly bullish, though approaching stretched conditions:
- RSI is in the 66–67 range, signaling strength but nearing overbought territory
- Volume is increasing alongside the price move, confirming buyer participation
- Volume delta remains positive, indicating buyers are in control
- Price is touching the upper Bollinger Band, reflecting strong upward pressure
- Parabolic SAR remains below price, confirming continuation of the uptrend
Momentum is accelerating into resistance, with RSI nearing overbought and price pressing the upper Bollinger Band - a combination that often signals a short-term pause ahead.
This combination typically appears during strong directional moves, but often coincides with resistance tests where momentum can temporarily stall. Silver Faces $78 Resistance After Breakdown Shift offers additional context on how resistance dynamics have been playing out across recent sessions.
Where Silver Price Meets Immediate Resistance Near 77.2–77.6
Price is now testing the resistance zone around 77.2–77.6, which aligns with the upper boundary of the current move. This area represents the first meaningful challenge following the recent acceleration.
Below, the structure remains supported by layered levels:
- 75.35 acting as the nearest support
- 74.90 and 74.25 forming a secondary support zone
- 73.40 marking deeper structural support
The 75.35 level is the first line of defense if sellers step in near 77 - losing it would shift attention back toward the mid-74 zone before any fresh upside attempt.
Additionally, the volume profile point of control near 72.36 continues to define the broader equilibrium zone beneath current price.
The Silver Move Is Intact – but Facing Its First Real Test
The current structure favors continuation, with higher lows and sustained momentum supporting the trend. However, proximity to resistance and stretched conditions introduce the risk of a short-term pullback.
If price holds above the 76 area and absorbs selling pressure near 77, the trend remains intact - but failure to maintain this zone could open a retracement into mid-75 before any further push higher.
If price holds above the 76 area and absorbs selling pressure near 77, the trend remains intact. Failure to maintain this zone, however, could lead to a retracement back into the mid-75 region before any further upside attempt. Momentum-driven extensions like this one continue to attract attention, as seen following Silver Breaks Higher With a 7.7% Rally Above Key Resistance - a move that set the tone for the current bullish phase.
 Alex Dudov