 Usman Salis
⬤ Silver is testing a critical resistance level again, with XAG/USD hovering around $53.25 on the hourly chart. The metal is pushing against a ceiling that has blocked multiple attempts throughout October and November. Price action shows Silver approaching the upper boundary of its recent range as buyers mount another challenge.
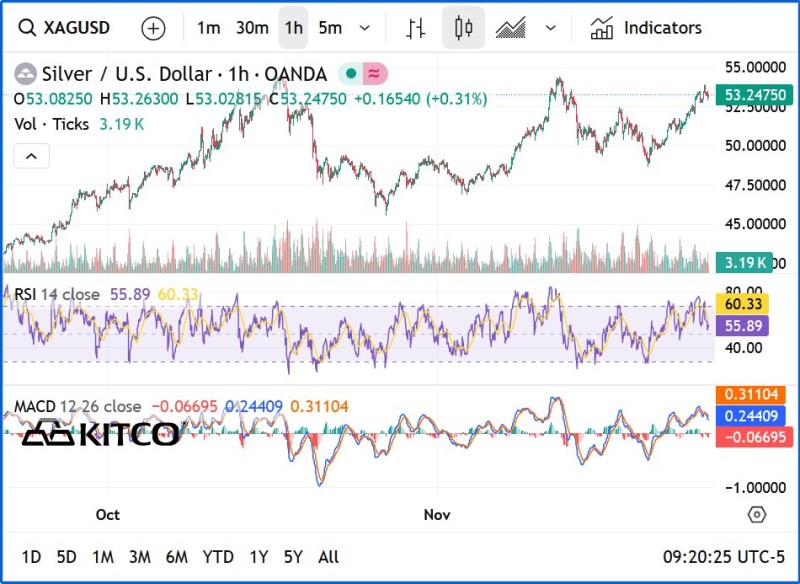
⬤ The rally shows persistent accumulation, with higher lows supporting the bullish trend despite occasional pullbacks. Trading volume sits steady at 3.19K ticks, reflecting consistent activity. The RSI reads 55.89, showing improving momentum without being overbought, while the secondary RSI at 60.33 highlights growing upward pressure. The MACD remains slightly above its signal line with a positive histogram, suggesting building momentum as price tests resistance. These indicators create conditions where a breakout becomes more likely if buying strength holds.
⬤ The XAG/USD chart shows several failed breakout attempts around the $53–54 zone, forming a well-defined resistance band. Each rejection has been followed by recoveries from higher lows, indicating sellers are losing control. This test comes after a consolidation period, which often precedes larger moves when momentum aligns. A confirmed break above this zone could push Silver toward the mid-$50s, while another rejection would keep it trapped in its multi-week sideways range.
⬤ This setup matters because Silver is testing a level that has consistently shaped near-term sentiment. A decisive move above resistance could shift momentum across the precious metals complex and influence short-term volatility. How XAG/USD behaves here may determine the next phase of market direction for both industrial and monetary metals.
 Usman Salis


