 Marina Lyubimova
⬤ Silver has shown impressive structural strength on the weekly timeframe, closing near $50 after a volatile trading period. The focus stays on the long-term weekly close chart, which filters out noise from short-term futures market swings. The metal finished the week down roughly 1.4 percent, but the broader trend remains solidly upward, with spot silver maintaining critical support that's been building since it broke above $48 six weeks ago.
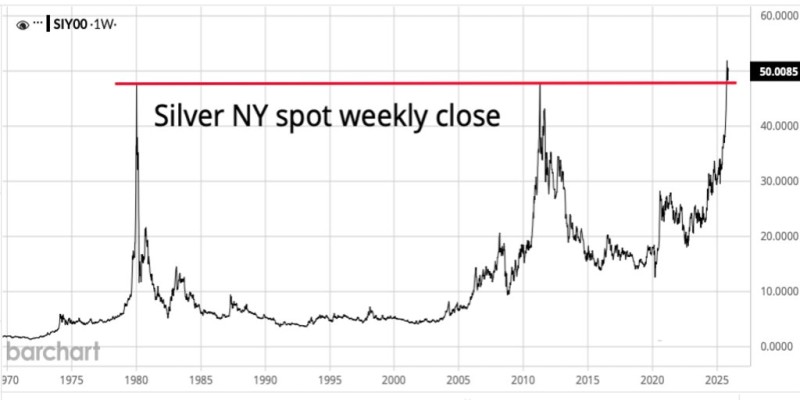
⬤ The chart shows that silver's move above the $48 level has turned this area into a major support zone. Price action in recent weeks reveals several attempts to push the market lower, yet weekly closes keep holding above this threshold. Last week included pressure in the paper market to drive prices down, accompanied by widening silver backwardation. Despite this pressure, the $48 level has held firm, pointing to continued stability in the underlying trend.
⬤ Broader market dynamics add more context to the current setup. Silver has climbed sharply in recent months, getting close to its historical peaks, with weekly price action now sitting just below the long-standing $50 zone. The chart shows how price has consolidated around this region while building a higher structural base compared with previous cycles. There are expectations for the gold-to-silver ratio to drop below 80, a move that would historically line up with faster gains in silver. If momentum keeps building, silver may break away from $48 and start a stronger rally in the first quarter.
⬤ This setup matters because silver's weekly chart reflects long-term confidence in the metal despite short-term volatility. Holding support above $48 reinforces the strength of the current bullish cycle and signals that broader demand remains solid. If silver continues holding above this key zone while approaching historical resistance, the metal could set up a more significant move in the coming weeks.
 Marina Lyubimova


