 Usman Salis

⬤ Silver got hammered Friday with XAG/USD posting one of its worst single-day crashes in decades. The drop hit roughly 26 percent and created a massive bearish candle on the daily chart that swallowed the previous 13 trading sessions whole. The size and speed of the move caught traders off guard, instantly replacing the calm with chaos after weeks of steady gains.
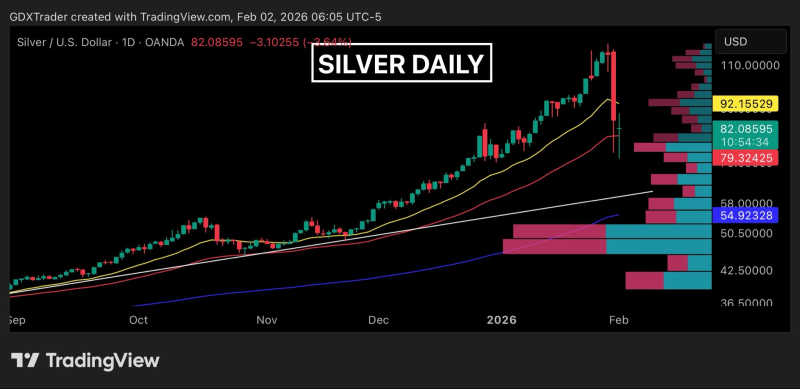
⬤ The next session brought flat to slightly lower action, forming a wide-range doji with both a lower high and lower low. This pattern shows ongoing selling and uncertainty rather than fresh panic. While the aggressive dumping eased compared to Friday's meltdown, sellers are still in the game, and the chart doesn't show buyers taking back control. The mix of big losses and weak follow-through shows just how unstable things remain on the daily timeframe.
⬤ What's striking about the current setup is there's no clear daily support level anywhere nearby. The sharp selloff blasted through multiple reference zones in one session, leaving almost nothing close by to work with. Daily chart signals don't offer much conviction right now since price action lacks obvious stabilization points. This structural gap adds to the confusion and makes it tough to figure out whether we're seeing continuation or reversal based on higher timeframe levels alone.
⬤ This matters for the broader market because silver's extreme swings highlight the dangers that show up when long directional moves unwind fast. The historic bearish candle and the indecision that followed show how price discovery gets messy once key momentum snaps. How XAG/USD performs in the coming days—especially whether it starts to find footing or keeps drifting without defined support—will likely shape near-term volatility and influence sentiment across the entire precious metals space.
 Usman Salis


