 Peter Smith

⬤ Silver's exceptional performance has brought the gold-silver ratio down to levels not seen since 2024, with the metric now hovering around 74. Tightening supplies worldwide have given silver newfound strength against gold, creating one of the sharpest moves in years. Bloomberg's historical chart tracking the ratio from the mid-1970s through 2025 shows just how significant this shift is within decades of commodity market cycles.
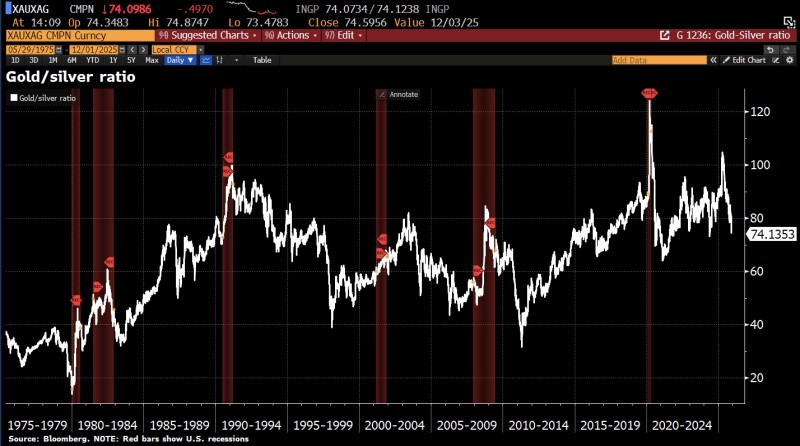
⬤ The gold-silver ratio tells you how many ounces of silver you need to buy one ounce of gold, making it a go-to measure for comparing strength between these metals. Today's reading near 74 is a major drop from peaks above 100 that we saw in early 2020 and again in 2023. Looking at the historical pattern, you can spot several moments when silver outpaced gold dramatically—the late 1970s, early 2000s, and mid-2010s all stand out. What's happening now ranks among the strongest silver performances since 2024, driven by supply shortages and solid demand from industrial users, while gold has been trading in a more stable range.
⬤ Bloomberg's long-range chart also marks U.S. recession periods with red bands, showing how economic stress and changes in liquidity have historically influenced precious metal dynamics. During past downturns, strong industrial applications and limited mining output often gave silver temporary leadership over gold. Today's pattern looks similar—global supply is getting tighter, and silver's price momentum is clearly outpacing gold's. The extended timeline helps put current moves in perspective by showing whether they're unusual or following familiar historical patterns.
⬤ The recent decline in the gold-silver ratio matters because it shows how the balance of power within precious metals is shifting during uncertain times. As supply constraints and broader economic trends continue reshaping price action, this ratio offers valuable insight into changing demand patterns, momentum shifts, and overall market sentiment. With silver continuing its strong run, the ratio remains a key indicator for understanding how the commodity landscape is adapting to evolving supply conditions and economic realities.
 Peter Smith


