 Usman Salis
⬤ The gold-to-silver ratio has crossed the 80 mark on an annual basis, hitting one of its highest points since the 1980s. Currently sitting around 2.58 standard deviations above its long-term historical average, this reading shows silver is trading at rock-bottom prices relative to gold. What makes this situation particularly unusual is how long it's lasted—over five years now, which is actually longer than the major divergence periods we saw back in the 1930s and 1980s. Looking at the historical data, the ratio's long-term average sits at 29.17, so we're seeing a pretty dramatic departure from the norm. The chart shows three major historical spikes: roughly three years above the 2.58σ threshold in the early 1930s, two years above that level in the 1980s, and now this current stretch of more than five years since 2020. This extended elevation really emphasizes how much stronger gold has been compared to silver during the current market cycle.
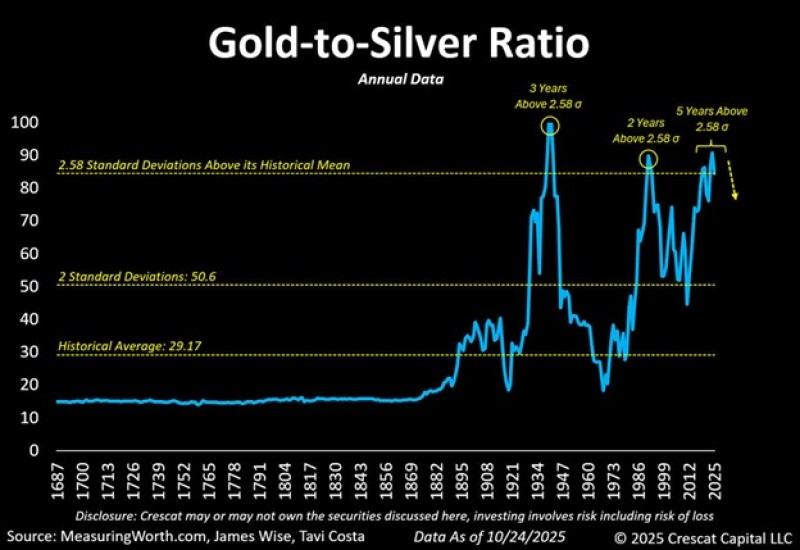
⬤ Even with precious metals experiencing a strong rally across the board, silver still looks undervalued when you examine this long-term ratio. The numbers tell a clear story—gold prices have stayed elevated while silver's performance has lagged behind, keeping the ratio stubbornly high. The fact that we're spending so much time above the 2.58σ line is pretty remarkable when you consider this dataset covers more than three centuries of market history. Historically, when the gold-to-silver ratio reaches these kinds of extremes and stays there, it often sets the stage for silver to play catch-up. These extended divergences matter because they shape how markets think about potential reversals, especially as investors weigh precious metals against broader economic trends, inflation pressures, and currency movements. With gold maintaining its dominant position and silver trading at historically discounted levels, the dynamic between these two metals will likely continue influencing sentiment across the commodities market in the coming months.
 Usman Salis


