 Saad Ullah
● Silver (XAG/USD) looks like it's gearing up for a significant breakout, according to a recent MiningFeeds.com analysis. The chart shows a classic inverse head and shoulders pattern — a technical formation that often signals a bullish reversal is coming.
● Here's how it could play out: the pattern points to a $63 price target, calculated from a $9 move above the neckline sitting around $54. If silver manages to break through that neckline with conviction, we might see one of the biggest rallies in precious metals this year.
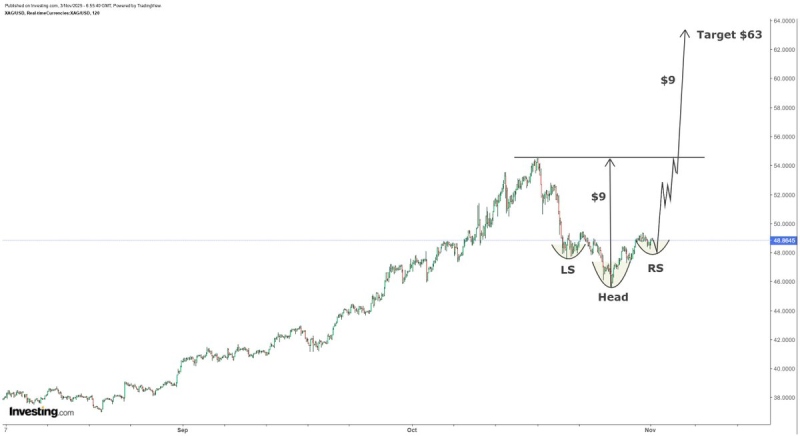
● But there's a catch. For this bullish scenario to work, silver needs to hold above the $48–$49 support zone and close strongly above $54 on a daily basis. If it fails to do that, or if the dollar suddenly strengthens, the whole setup could fall apart and prices might drift back into consolidation. Analysts also warn that any surprises in economic data or interest rate expectations could shake things up in the short term.
● If silver does break above $54, it could shift sentiment across the entire metals sector. The analysis notes that with the Gold/Silver Ratio around 70, silver hitting $63 would put gold near $4,400 per ounce. Looking further out, if that ratio tightens to 57, the projections get even more interesting — gold could reach $4,900 while silver climbs to $85. That would represent a major revaluation of both metals as inflation hedges and industrial commodities.
● This technical setup comes at a time when investors are showing renewed interest in tangible assets, driven by inflation worries, government spending, and growing industrial demand for silver in renewable energy applications. A confirmed breakout could signal that the next phase of the commodity supercycle is already underway.
 Saad Ullah


