 Eseandre Mordi
⬤ Silver (XAG) has been trading sideways after a steep drop from recent highs, with prices now settling between $73 and $75 on the hourly timeframe. The metal is hovering around the mid-$74 level as the market takes a breather following the correction. Recent upward moves look more like short-term reactions than anything sustainable, and the overall picture still leans slightly downward despite a rising trend line visible on the chart.
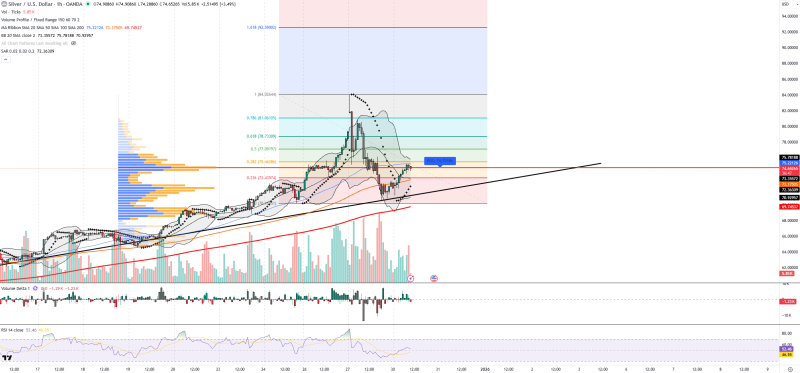
⬤ Sellers keep stepping in near the top of the range, especially when silver approaches $75. The Point of Control on the volume profile sits around $74.75, marking where most trading activity is concentrated. For silver to show real strength, it needs to break and hold above $75.70. Right now, the Bollinger Bands show price action stuck near the middle band, confirming consolidation rather than any clear trend. Moving averages are bunched together around current price levels, reinforcing the sideways feel.
⬤ Technical indicators are sitting on the fence. RSI is near 52, meaning momentum could go either way. Trading volume has dropped off during the recent bounce, suggesting buyers aren't particularly aggressive. Volume Delta remains negative, pointing to ongoing selling pressure. The Parabolic SAR dots above price hint at downside risk in the near term. Key support levels to watch are $73.35, $73.17, $72.36, and $69.75, while resistance sits at $74.65, $75.22, $75.78, and $81.00.
⬤ Silver's price action matters because the metal reacts quickly to macro shifts given its role in both investment portfolios and industrial production. Changes in gold prices and renewed dollar strength are keeping pressure on XAG. With silver locked in the $73-$75 range and volatility expected to stay elevated, traders are watching whether consolidation leads to a breakout above $75.70 or if the sideways-to-down pattern continues in the sessions ahead.
 Eseandre Mordi


