Saad Ullah

⬤ Silver went through a wild ride during the latest session, giving back a solid 3.5% intraday jump and showing just how choppy things have gotten. The metal's been hanging around a key technical spot where a double-top pattern recently showed up. The daily chart captures silver pulling back after a quick push toward the $52-$54 range, with the latest candle showing how fast momentum can shift.
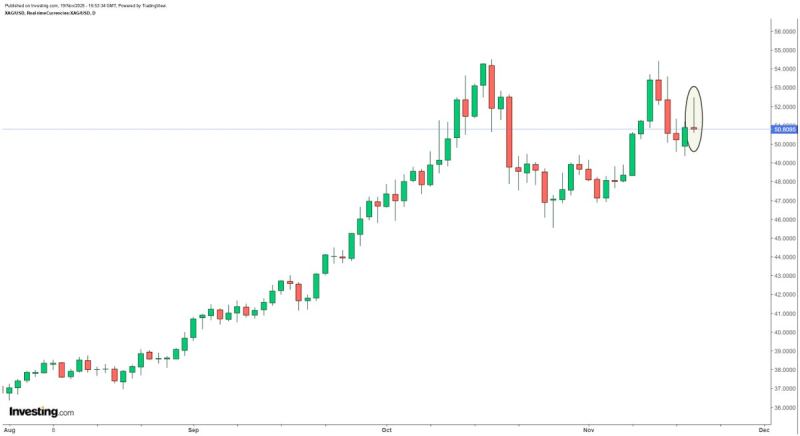
⬤ The chart shows the strong climb that kicked off in August and picked up steam through September and October, lifting silver to multi-month highs before hitting resistance. The highlighted candle displays a large upper wick that captures the day's failed advance, with silver settling near $50.80 after earlier poking above $52. The intraday swing is textbook volatility, happening as silver consolidates below the recent peaks that formed the double-top. The pattern shows repeated attempts to push through the $53-$54 zone before momentum dried up.
⬤ Market sentiment hints that silver might enter a more explosive phase once it breaks cleanly above the double-top area. There's talk that a parabolic move could be on the table, suggesting a breakout past recent highs might unlock more upside. The chart shows a clear resistance level that's been on traders' radar. The latest candle highlights the struggle to hold gains near that zone, with price swings staying wide as silver tries to find footing around $50-$51 support.
⬤ Silver's quick intraday reversal shows how reactive the metal's become to momentum shifts during volatile stretches. The mix of strong uptrends, repeated resistance tests, and sharp pullbacks will likely keep shaping sentiment going forward. With silver sitting near a major technical boundary, upcoming action around the double-top could determine whether the metal keeps consolidating or builds enough steam for another breakout attempt.
 Saad Ullah