 Peter Smith

⬤ Silver (XAG/USD) took a steep nosedive during the session, tumbling from around $58.90 down to nearly $58.05 within minutes. The drop came as a shock move that broke through key short-term support levels and sent volatility soaring. The chart captured a vertical red candle that marked the intense selling wave, completely disrupting the metal's earlier upward climb.
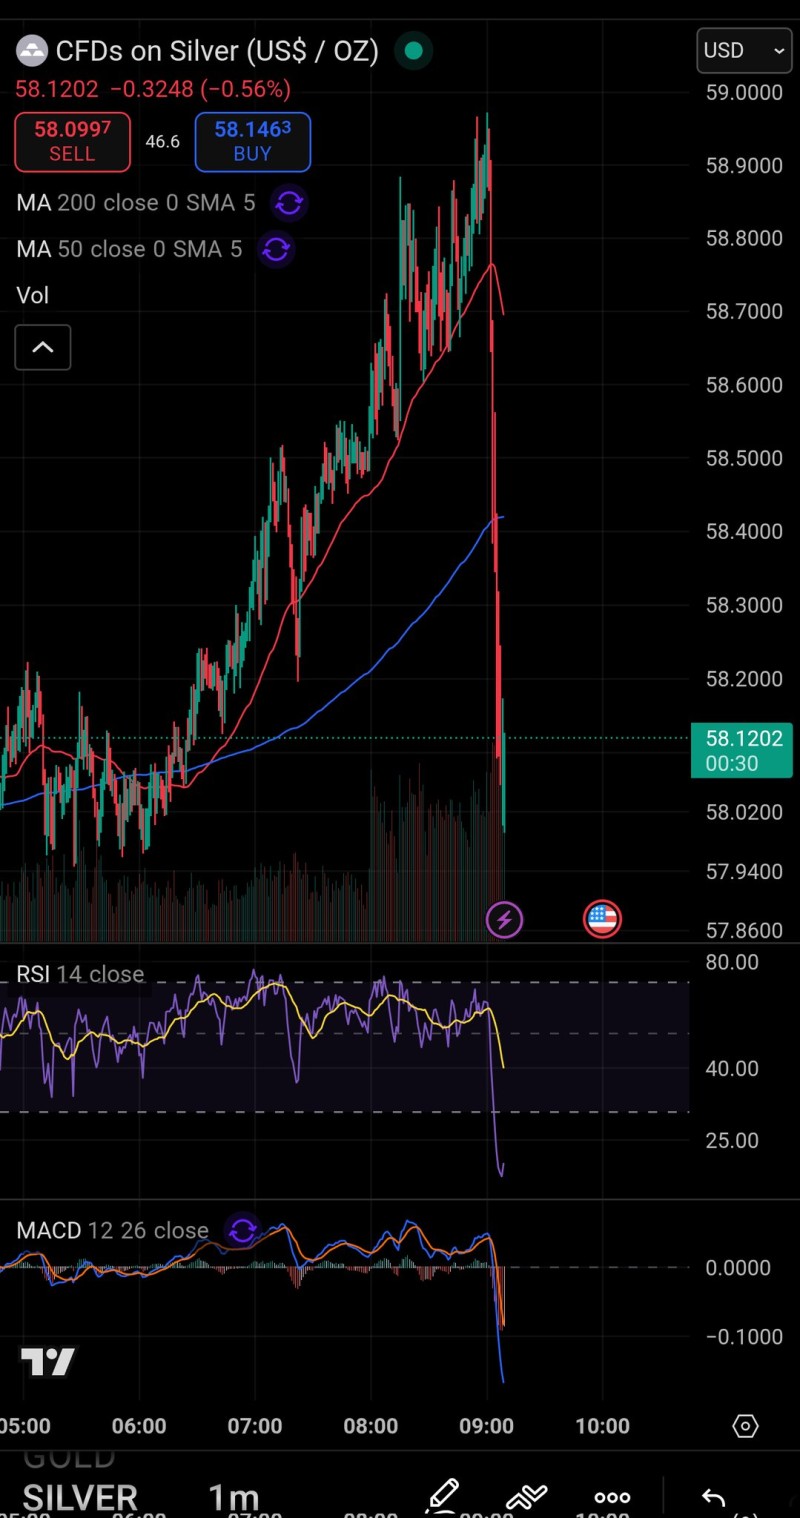
⬤ The selloff drove XAG/USD below both the 50-period and 200-period moving averages on the one-minute timeframe, signaling a clear momentum shift. The RSI immediately plunged into oversold territory, while the MACD flipped sharply negative as bears took control. Silver had been working its way toward the $59.00 mark earlier in the day, but the sudden reversal stopped that advance cold and put traders on edge.
⬤ Volume jumped notably during the decline, pointing to a flood of sellers entering the market as the move picked up steam. A small bounce materialized around the $58.10 zone afterward as XAG/USD tried to find its footing, though the overall picture stayed shaky. Traders are now keeping a close eye on whether this was just a quick liquidity grab or the start of something bigger for silver.
⬤ Sharp dislocations like this in the silver market often hint at broader changes in risk appetite. Since silver tracks closely with macro trends, inflation expectations, and market liquidity, sudden price swings can carry meaning beyond just the metal itself. What happens next around the $58.00 support zone will help determine whether volatility settles down or continues driving price action in the sessions ahead.
 Peter Smith


