Saad Ullah

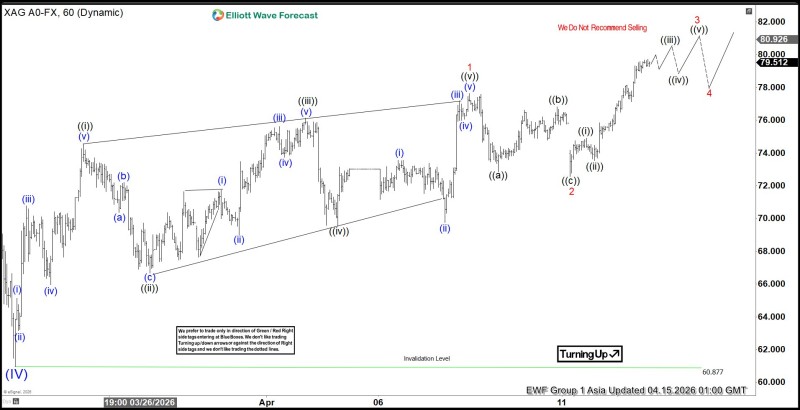
Silver continues to trend higher following a structured recovery, with wave labeling indicating a developing bullish sequence that could extend further. According to Elliottwave Forecast, the technical roadmap points toward a potential move all the way to $89 - a target that remains active as long as the current structure holds.
From the lows near the $60 area, silver established a sequence of higher lows supported by an ascending trendline. This trendline remains intact throughout the chart and continues to act as a dynamic base for the ongoing move, guiding each new leg higher without any meaningful structural break.
Silver Elliott Wave Structure: The Framework Behind the Move
The chart shows a multi-leg progression typical of Elliott Wave development, where earlier corrective phases have already unfolded and price is now advancing within a higher-degree impulse.
Wave labeling highlights completed subwaves and an ongoing upward sequence, suggesting the market is not yet in a terminal phase. Instead, price appears to be transitioning through the later stages of an impulsive cycle - a position that historically carries meaningful remaining upside.
For broader context on how silver has been navigating key technical zones, Silver Tests $50.23 Resistance as Price Faces Key Decision Zone covers how the metal approached its prior resistance before breaking out.
Silver Price Action: Controlled Advance With Defined Pullbacks
Recent price action shows a steady climb into the upper $70s, with corrections unfolding in a measured way rather than breaking structure. The chart outlines a prior corrective wave labeled wave 2, followed by a renewed push higher - precisely the kind of behavior that characterizes a healthy impulse sequence rather than a trend that is running on fumes.
Pullbacks are expected but should remain contained within the trend - that type of shallow correction is consistent with broader bullish continuation.
The projected path suggests a continuation higher after a brief consolidation phase, with a potential pullback forming before the next extension leg. This mirrors setups seen in previous silver rallies - where price advances within a channel or wave sequence and each shallow dip ultimately leads to extended upside. The Silver Breaks Higher With a 7.7% Rally Above Key Resistance episode is one example of how quickly silver can accelerate once it clears structure.
Silver's $89 Target: Wave Projections and Key Levels
The forward path on the chart outlines a continuation toward higher levels, with wave (iii), (iv), and (v) projections pointing to an initial advance above $80, followed by a larger move toward $89. The structure implies several things about where silver stands right now:
- The broader trend remains upward with no structural breakdown
- Pullbacks are expected but should remain contained within the trend
- The current wave sequence has not yet completed
- The bullish projection stays valid as long as the broader structure holds
An invalidation level is marked near $60.877 on the chart, reinforcing that the long-term bullish count remains intact unless that level is breached. The distance between current prices and that invalidation point gives bulls considerable room to work with.
Silver is not accelerating uncontrollably but building methodically - structure taking precedence over momentum spikes, which often signals continuation rather than exhaustion.
This methodical build is exactly what wave analysts look for when projecting extended targets. A market that surges without structure tends to reverse sharply; one that climbs through defined subwaves tends to follow through. The $89 target stays in focus precisely because the framework that generated it remains unbroken. For a sense of how far silver could travel over a longer horizon, Silver Triangle Setup Points to a $150 Long-Term Target provides additional context on t
 Saad Ullah