Alex Dudov

Silver is making a decisive move after pushing above a compressing wedge formation on the weekly timeframe - a structure that had been capping upside for an extended period. As Rashad Hajiyev noted, the breakout is taking place on the weekly chart, reinforcing its significance from a structural perspective. The key question now is whether price can sustain at higher levels and confirm the transition from correction into continuation.
The Silver Compression That Built the Wedge
The chart shows a well-defined wedge structure, formed by converging trendlines as price carved out lower highs while holding support below.
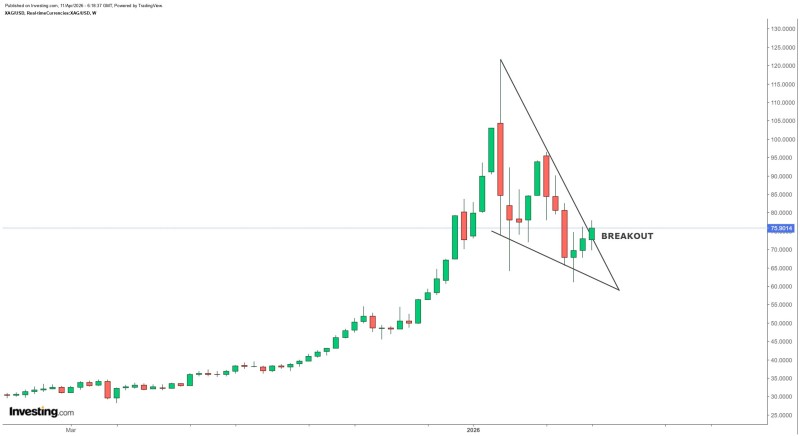
This tightening range is a classic sign of compression - volatility decreasing while pressure builds toward an eventual resolution.
The compression within a wedge is not a sign of weakness. It is a coiling of energy, and the direction of the break reveals where that energy is headed.
Rather than continuing to reject from the upper boundary, price has now moved beyond it. This marks a clear shift in behavior - from resistance holding to resistance giving way.
The Silver Breakout That Signals a Change in Control
The move above the wedge boundary suggests that sellers are no longer able to maintain the sequence of lower highs - often the first real indication of a structural transition. Price is now holding near the breakout area around the mid-$70s, showing early signs of acceptance above former resistance.
In technical analysis, the moment where resistance begins to act as support is a key signal that a breakout may be valid rather than a false move. Silver Breakout Holds After Broadening Wedge Retest highlights exactly this dynamic - holding above a former wedge boundary tends to signal continued structural strength.
Why the Weekly Chart Silver Breakout Carries More Weight
The fact that this pattern developed on the weekly timeframe adds meaningful weight to the move. Higher timeframe breakouts reflect longer-term positioning rather than short-term noise, which makes them harder to fake and more significant when they hold.
The structure now reflects a transition from correction into potential continuation, with silver no longer confined within the wedge boundaries. Setups like Silver Breakout Targets $96 After Retest Holds demonstrate how breaking key resistance structures can shift momentum toward expansion phases - and the current weekly breakout fits within that broader picture.
The Structure Now Favors Silver Continuation
There are no immediate signs of rejection back into the wedge. Price is stabilizing above the breakout zone, and the structure is holding.
- Former wedge resistance is now acting as a support area
- Price is holding near the mid-$70s breakout zone
- No immediate rejection signals visible on the chart
- The weekly timeframe adds structural weight to the move
A breakout is only as meaningful as the follow-through. Right now, silver is doing what it needs to do - holding the zone and building above it.
As long as silver remains above the former resistance area, the breakout stays intact. Silver Breaks Descending Trendline on 12H Chart, Targeting $145-$150 in New Bull Phase provides additional context on how trendline breaks at key levels can open the door to extended moves in silver.
Silver is no longer compressing - it is resolving. The weekly wedge breakout marks a structural shift, and as long as price holds above the breakout zone, the chart favors continuation over reversal.
 Alex Dudov