 Marina Lyubimova

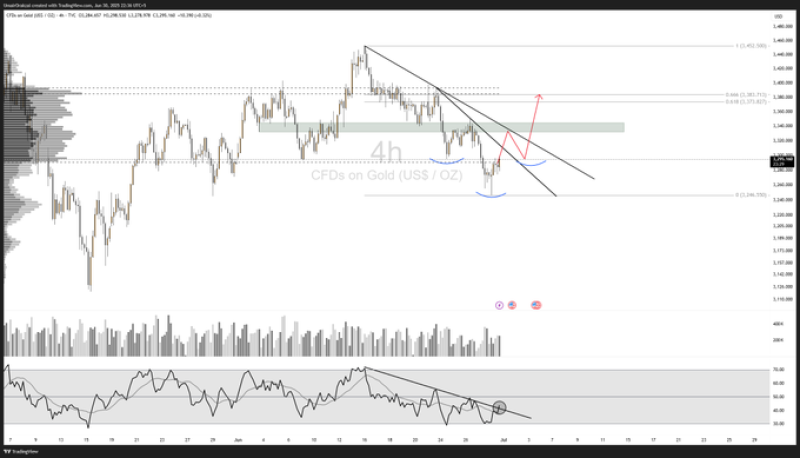
Gold (XAU/USD) is back in focus for traders as technical indicators suggest a potential shift in momentum. A recent chart shows signs of a bullish breakout forming, with key levels now in play.
RSI Breakout Sparks Momentum Hopes
The Relative Strength Index (RSI) on the 4-hour gold chart has broken above its descending trendline. This breakout could mark the beginning of a short-term bullish phase, especially if the price confirms above key horizontal resistance.
The RSI move comes after a prolonged downtrend, and this technical development has historically preceded price recoveries in gold. Momentum watchers are now closely observing whether the price of gold can hold above $2,340.
Price Levels to Watch: $2,340 Support and $2,380 Target
The price chart also shows gold breaking out of a descending wedge pattern. If this movement sustains and volume increases, the next logical upside target lies at $2,380 — the upper resistance zone from earlier in June.
However, failure to confirm the breakout could push gold back toward the $2,320–$2,325 support region. The trader notes that closing above this zone is crucial for bulls to stay in control.
Conclusion
Gold is once again at a technical crossroads. With RSI attempting a breakout and price action aligning with bullish patterns, the coming sessions could prove pivotal. Traders should watch for confirmation and volume before committing to a directional move.
 Marina Lyubimova


