 Eseandre Mordi

⬤ Gold kicked off a major bull run after smashing through a critical technical level in early 2024. XAU broke out of a 13-year Cup and Handle formation in March 2024, ending over a decade of sideways trading. The long-term chart shows price blasting through the former resistance zone and accelerating hard afterward.
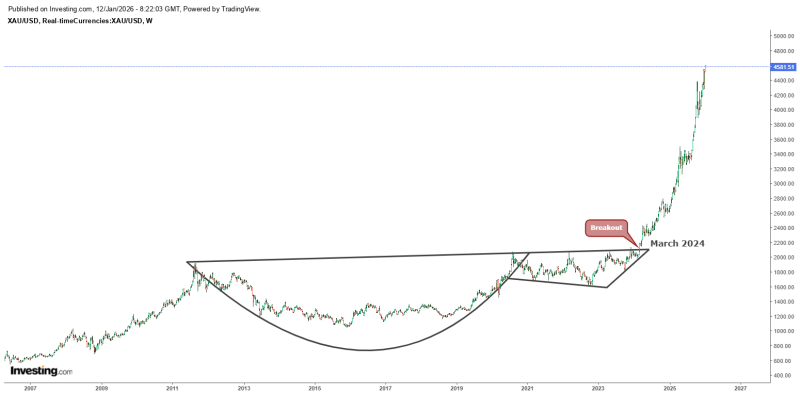
⬤ For years, gold was stuck trading below a gradually rising resistance line. Then March 2024 hit, and everything changed. Gold transitioned into a steep uptrend, climbing in near-parabolic fashion. The numbers tell the story: gold's up roughly 120% in less than two years since the breakout, a move clearly visible in the sharp rally angle on the weekly chart.
⬤ Here's what matters: price hasn't looked back. Gold's been holding strong well above the old consolidation range with no major pullbacks to the breakout zone. Long-duration Cup and Handle patterns like this don't show up often, but when they do resolve, they typically signal the start of extended trends rather than quick pops.
⬤ This move in XAU represents a fundamental shift after years of range-bound price action. Multi-year technical breakouts like this tend to reshape trader expectations around trend duration and volatility. With gold trading well above former resistance and maintaining its upward momentum, the rally is influencing sentiment across precious metals markets and setting new long-term expectations for the sector.
 Eseandre Mordi


