 Saad Ullah

⬤ Gold just made a quick run past the $4,700 mark before cooling off around $4,740. What's interesting here is that the breakout didn't meet much resistance from short sellers, suggesting there weren't many traders betting against gold at that level. The price chart shows a clean break from a downward channel, followed by a strong push higher and then this recent pullback from the top.
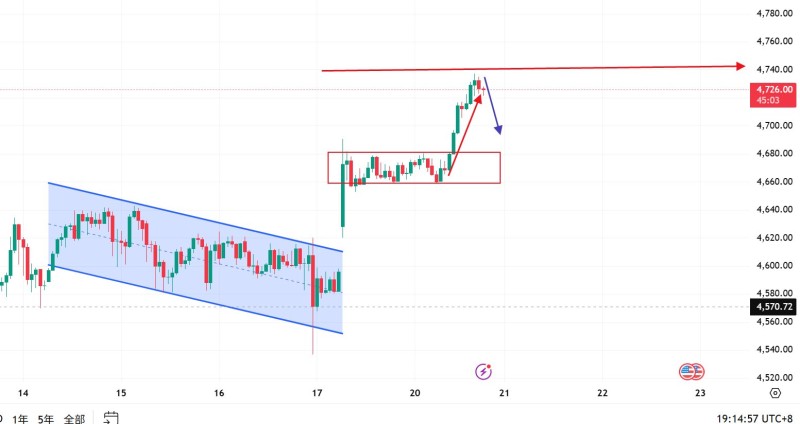
⬤ Before things heated up, gold was stuck in a downward-sloping channel—basically moving lower in a controlled way. That pattern broke when buyers stepped in hard, pushing price out of the channel and into a consolidation zone around the mid-$4,600s. From there, buying pressure really picked up steam, driving gold all the way to $4,740 before the market decided to take a breather.
⬤ Right now, all eyes are on $4,700 as the key level that could determine what happens next. So far, the price is holding above this area, which suggests we might just be seeing a pause rather than a full reversal. The chart shows higher lows forming after the breakout, meaning buyers are still showing up near support levels. If gold dips back to $4,700, there's a decent chance buyers will step in to defend it.
⬤ Why does this matter? Because $4,700 has basically flipped from being a ceiling to being a floor. How gold behaves around this level will likely shape where it goes in the short term. If it holds above support, the recent breakout stays valid and momentum could continue. But if we see a clean break back below $4,700, the old trading range could come back into play and open the door for more downside. The next move depends on whether buyers show up to defend that support zone.
 Saad Ullah


