Peter Smith

⬤ Gold prices have pushed back above the $4,300 per ounce mark after taking a hit in November. The XAU chart shows the precious metal getting back on track in December following a retreat from record highs set earlier in the quarter. It's been a solid recovery after what was a brief but steep correction.
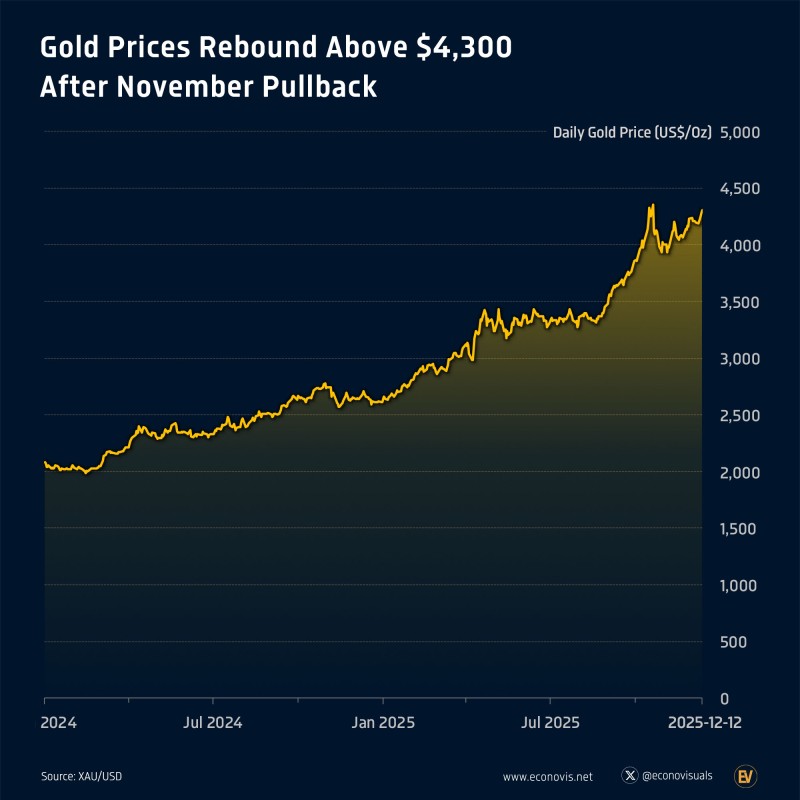
⬤ Gold hit an all-time peak of $4,357 per ounce on October 20, 2025, before running into some selling pressure. From there, it dropped 9.7% — about $424 — bottoming out at $3,932 per ounce on November 4, 2025. The chart captures this pullback clearly, showing momentum cooling off after a long rally that carried gold higher throughout most of 2024 and into 2025.
⬤ After hitting that early November low, gold started clawing its way back. The recovery picked up steam in late November and carried into December. By December 12, 2025, XAU had climbed to around $4,302 per ounce, erasing nearly all the November losses. The chart shows the renewed uptrend, with prices settling above earlier support zones and holding strong heading into year-end.
⬤ This rebound is worth watching because gold tends to reflect what's happening across the broader economy and market sentiment. A return to near-record levels after such a sharp drop signals there's still solid demand underneath. With prices back above $4,300, gold's next moves could shape expectations across commodities, currencies, and financial markets as traders gauge whether this late-2025 rally has legs.
 Peter Smith