Saad Ullah

⬤ Gold has bounced off its 200-day moving average, a technical level that typically defines long-term trend direction. Price pulled back toward the 200DMA near $4,100 before recovering higher, pointing to renewed buying interest at that zone. As Barchart noted, the last time gold tested this level was late 2023 - right before a significant upward move.
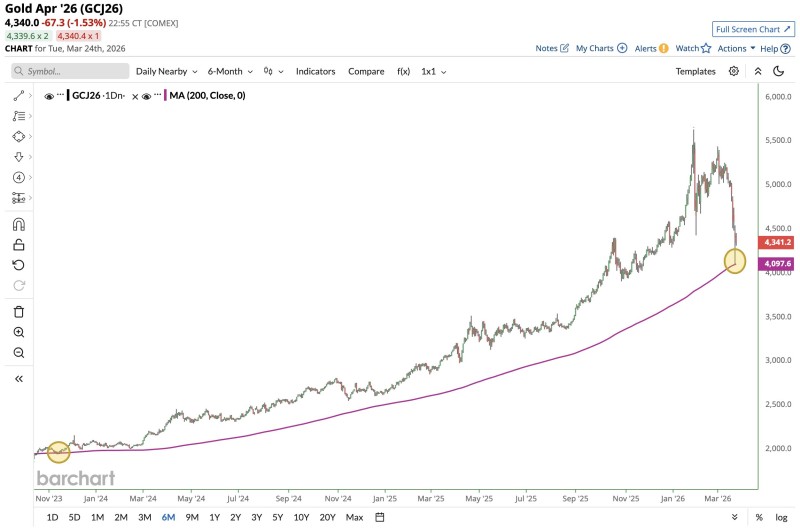
⬤ The broader XAU trend remains firmly bullish, with price climbing from under $2,000 in late 2023 to above $5,000 at recent highs. The current dip looks more like a healthy correction than a structural breakdown. The 200DMA, sitting near $4,097, is acting as dynamic support - reinforcing its role as a long-term technical anchor. Similar behavior is outlined in Gold 40-Week MA Holds Near 4100 After Drop From 5000 Highs.
The last time gold touched this zone, it turned into a launch pad for one of the strongest rallies in years.
⬤ Buyers are stepping in at historically significant levels, with the bounce closely matching previous support reactions. The comparison to late 2023 shows gold used the same zone as a launch point for a strong upward move. Related setups are explored in Gold Tests $4660 as Key Support Break Risks Deeper Slide to $4380, where structure around support levels defined directional momentum.
⬤ The 200-day moving average remains a critical benchmark for gold market structure. Holding above it keeps the broader uptrend intact, while a breakdown could shift sentiment and open the door to deeper losses. As discussed in Gold Tests $5000 as $4800-$4600 Demand Zone Comes Into Focus, demand zones around key levels have consistently shaped price direction - and the current reaction underlines their continued relevance.
 Saad Ullah