 Alex Dudov

⬤ Bitcoin's been moving sideways on the hourly timeframe after stepping back from the $90K area earlier this week. Right now it's finding its footing between $87,500 and $88,000 as traders digest the recent rally and figure out what's next. The short-term action looks like a breather, though the bigger picture still leans bullish.
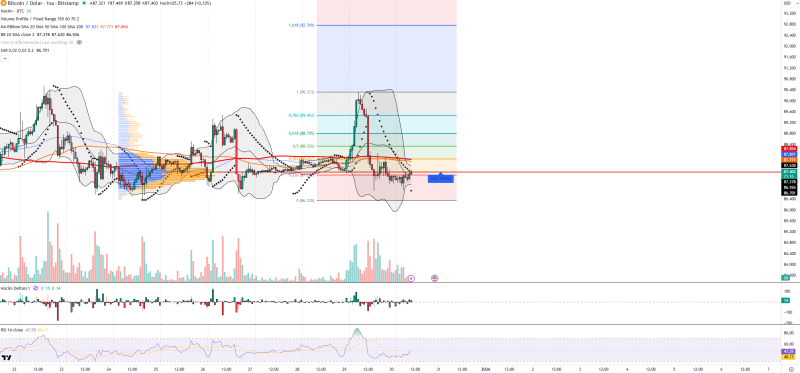
⬤ On the chart, BTC is sitting just under the middle Bollinger Band—a sign that the market's still working through its correction after that spike higher. Support levels are stacked at $87.40, $86.93, $86.50, and $85.20, while resistance is waiting at $87.85, $88.33, $89.46, and $90.31. The Point of Control on the volume profile lands at $87.38, marking this as the sweet spot where most of the action's been happening lately. Meanwhile, those Parabolic SAR dots are still floating above price, hinting that the bears haven't fully backed off yet.
⬤ Indicators aren't giving much away right now. RSI's hovering around 47–48, which basically means momentum's stuck in neutral with no strong push in either direction. Volume's dropped off since the run toward $90K, which makes sense—this feels more like a pause than a trending move. Volume delta is balanced too, showing buyers and sellers are pretty evenly matched at the moment. For the bulls to really take charge again, we'd need to see a clean break above that upper Bollinger Band.
⬤ What makes this interesting is that Bitcoin's consolidating near the top of its range while the broader mood stays supported by ETF inflows and healthy risk appetite. But in the short run, some profit-taking and dollar index swings are keeping a lid on things and keeping volatility alive. With BTC parked near $87,500 and those key levels mapped out, traders are watching to see if this consolidation breaks higher toward resistance or dips back down to test deeper support if the selling pressure sticks around.
 Alex Dudov


