 Usman Salis

⬤ Zeta Global Holdings Corp. keeps getting pushed back every time it tries climbing above its monthly bull market support band. This area's now working against the stock instead of helping it—basically flipping from support to resistance. The stock can't seem to get its footing back.
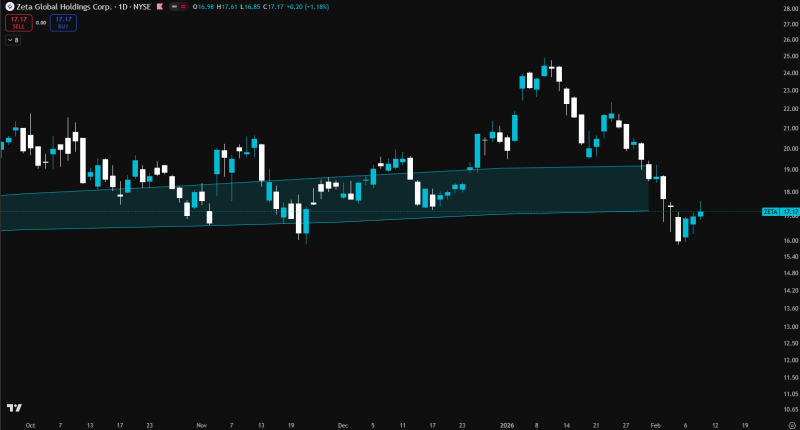
⬤ The chart shows ZETA made a run toward the mid-$20s before turning around and sliding back down near $17. It looks like a classic ZETA support zone test where price comes back to check an important technical spot after failing to push higher. Every attempt to break above the band has been met with rejection.
⬤ Right now, ZETA's consolidating just underneath this structure. When a stock gets rejected from a long-term resistance level, it usually struggles to build momentum back up—especially when a former support area becomes overhead pressure. The stock's trading in a tight range after dropping from its earlier highs.
⬤ This setup puts ZETA at a technical crossroads where price at critical monthly support area behavior really matters for what comes next. If the rejections keep happening, the downside bias stays in play. But if ZETA manages to reclaim the band, it would signal a structural shift back toward the previous trend environment—similar to what happened with Meta stock rejecting its 200-day average at $660.
⬤ For now, the stock's stuck in no man's land, unable to convince buyers it's ready to move higher. Until ZETA proves it can hold above that monthly band, the pressure stays tilted to the downside.
 Usman Salis


