Peter Smith

⬤ Zeta Global Holdings stock has entered a volatile phase after reversing sharply from recent highs. The daily chart shows a strong advance followed by a rapid pullback, marking what appears to be an overshooting B-wave move—often associated with a bull trap where price briefly exceeds resistance before reversing lower to test deeper support levels.
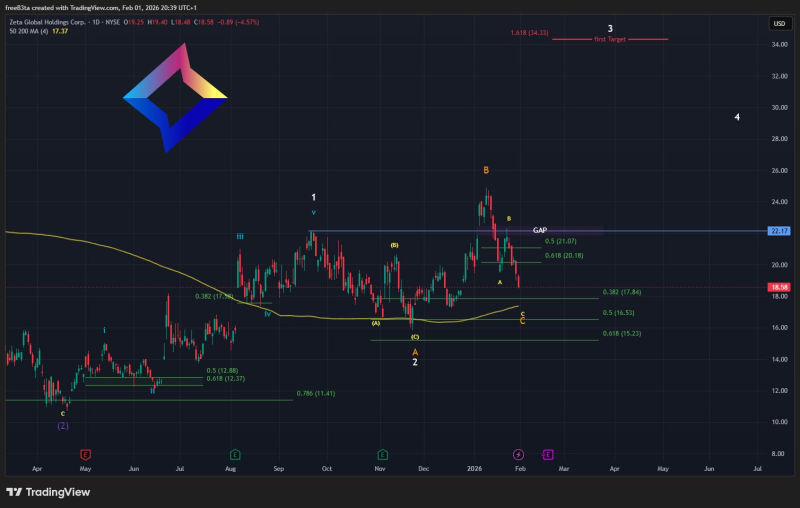
⬤ The chart shows accelerating downside momentum after the failed breakout, with ZETA now trading below several short-term support zones. Fibonacci retracement levels point to multiple downside targets, with the 200-day moving average emerging as the most likely level to be tested. This average sits in the mid-to-high teens, aligning with the 0.382 retracement region. This behavior is typical during corrective phases following sharp but unsustained rallies, especially when broader market volatility picks up.
⬤ Despite near-term downside risk, the longer-term technical picture remains constructive. The chart outlines a clear upside objective near $34.5, corresponding to a 1.618 extension level marked as the first major target. This reflects the broader bullish thesis once the corrective phase completes and price stabilizes. The presence of well-defined downside levels and a clear upside extension suggests continued volatility rather than a clean directional move in the immediate term.
⬤ This setup shows how corrective pullbacks can coexist with longer-term bullish frameworks. Volatile retracements often help reset positioning and establish stronger bases for future moves. How ZETA behaves around the 200-day moving average will determine whether downside pressure continues or whether the stock begins rebuilding momentum toward its longer-term targets in the weeks ahead.
 Peter Smith