 Sergey Diakov
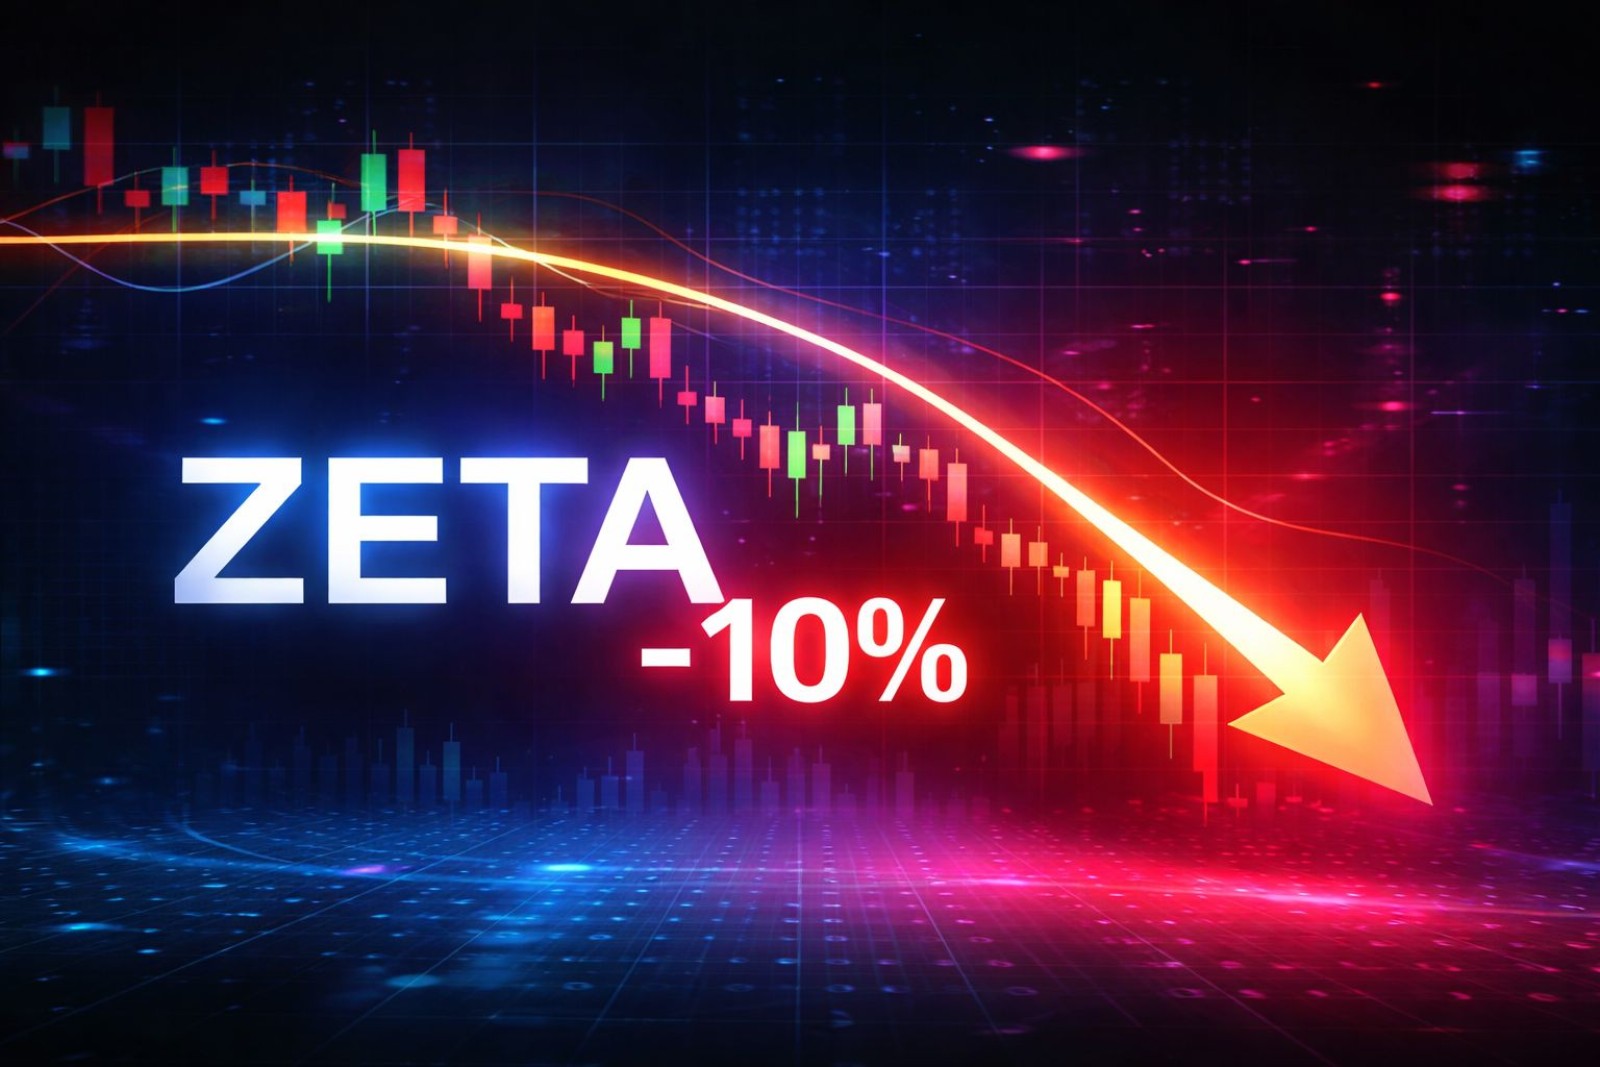
⬤ Zeta Global Holdings Corp. (ZETA) shifted into correction mode after failing to hold its recent rally. The daily chart shows the stock pulling back from the mid-$20s toward $20—a clear pause after what had been a solid run higher.
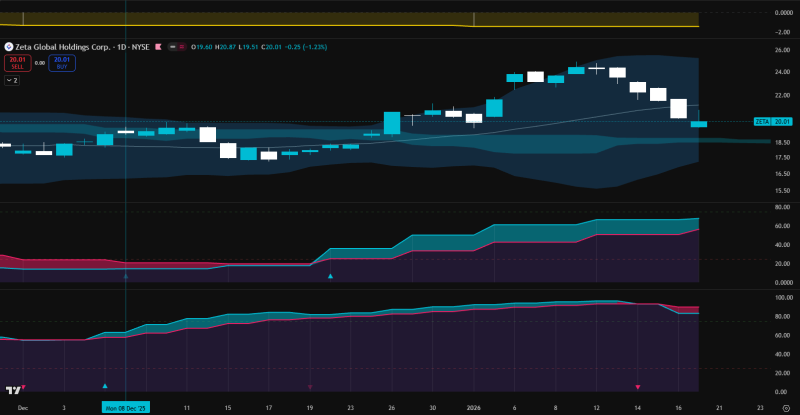
⬤ The first red flag came when the fast Stochastic indicator crossed lower last week. Since that crossover, ZETA's dropped roughly 10%. The candles tell the story: what used to be higher highs has turned into tight, compressed ranges. Buying pressure's fading, and short-term traders are getting cautious.
⬤ Here's what matters most: ZETA closed below its 20-day simple moving average. That line had been rock-solid support during the uptrend—every dip got bought. Now that it's broken, the immediate trend support is gone, and we're likely looking at more choppiness or downside ahead. The momentum indicators at the bottom of the chart? Still elevated compared to earlier months, but they're rolling over. This looks like a correction, not a breakdown.
⬤ ZETA had been one of the market's stronger performers before this cooldown started. Pullbacks like this often reset the technicals after extended moves—giving indicators time to normalize before the next leg. How the stock handles current levels will tell us whether it's ready to rebuild... or if it needs more time to digest those gains.
 Sergey Diakov


