 Marina Lyubimova

⬤ Zeta Global Holdings Corp. is holding a solid technical pattern on the daily chart, showing consistent higher highs and higher lows. Trading around $21.75, the stock has moved through steady climbs and pullbacks that keep the upward trend alive. Rather than entering deep corrections, ZETA tends to bounce within its trend channel, maintaining momentum through measured price swings.
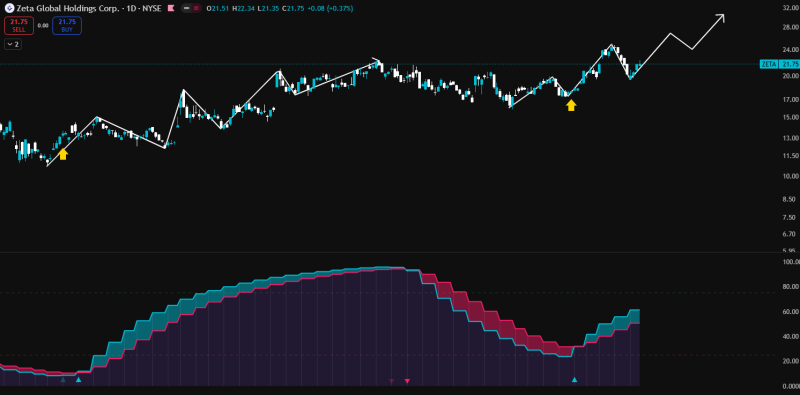
⬤ The chart shows ZETA finding support at increasingly higher points, with each pullback staying above previous lows before pushing higher again. These bounces demonstrate strong buying interest at key levels, with directional markers highlighting how each dip gets bought up quickly. The projected path suggests the trend should continue within this framework unless something fundamentally changes in the price structure.
⬤ Momentum readings back up what's happening with price. The indicator stays mostly in the blue zone, matching up with the stock's upward moves. When momentum strengthened before, it lined up with rebounds from those higher low areas, showing that momentum and price are working together right now. There's no divergence or breakdown showing up on the chart at this point.
⬤ What makes this setup interesting is how clean and orderly the trend looks—it's driven by consistent structure and solid momentum rather than wild swings. As long as ZETA keeps printing higher lows and momentum stays supportive, the stock will likely stick with this trend pattern. Watch for momentum shifts or breaks below rising support—those would be the signals that this structure might be changing course toward consolidation.
 Marina Lyubimova


