 Saad Ullah

Zeta Global Holdings is sitting at a crossroads. After months of grinding lower, the stock is now approaching a technical zone that analysts say could mark the end of its corrective cycle and the beginning of something much bigger. For investors watching the chart, the next few weeks may matter more than most.
ZETA Nears $13-$15 Fibonacci Exhaustion Zone
Trading around $16.95 after an extended downtrend, ZETA is closing in on what MindInvestor has identified as a defined reversal zone on the weekly chart. The Elliott Wave structure visible in the price action suggests one final leg lower may still be pending before the corrective sequence wraps up. That last push would bring price into the $13-$15 range, a region that lines up precisely with the 1.618 Fibonacci extension, a level historically associated with trend exhaustion.
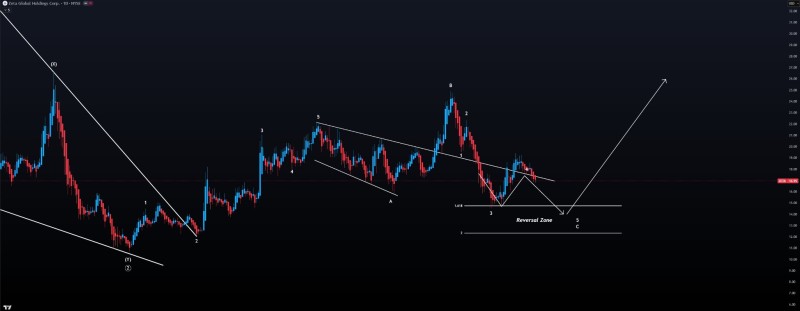
This zone is not new to ZETA watchers. The stock previously tested levels near $14.70 during a broader market selloff, which reinforced the area as a key decision point. Now, with price approaching from above, the question is whether buyers will step in early or wait for a deeper flush. As MindInvestor noted in the original breakdown, ZETA Stock Falls 8% Toward Lower Trendline as SaaS Weakness Persists, confirming the mid-$14 level as a recurring pressure point for the stock.
Elliott Wave Points to a $66 Target if Reversal Confirms
ZETA's struggles are not isolated. Across the SaaS sector, growth stocks have failed to reclaim higher ground as selling pressure persists through early 2025. ZETA has been no exception, repeatedly testing lower support levels while upward attempts fade quickly. This broader weakness has kept sentiment cautious even among longer-term bulls.
That said, the longer-term picture tells a different story. If the current correction completes inside the reversal zone and a new Elliott Wave cycle begins, analysts are pointing to a target near $66. That represents roughly 380% upside from current levels, a projection covered in detail in ZETA Stock Eyes $66 Target as Elliott Wave Breakout Builds in 2026. A similar case is laid out in Zeta Global Eyes $66 Recovery Target After SaaS Drawdown, which frames the potential recovery within the context of a post-drawdown base.
Whether ZETA stabilizes here or takes one more dip into the $13-$15 zone, the setup is worth watching closely. Corrective structures like this one often resolve into sharp recoveries in volatile growth stocks, and this chart, at this level, is building the kind of tension that tends to precede a move worth remembering.
 Saad Ullah


