 Usman Salis

Tesla has emerged as one of the market's top performers lately, pushing through key resistance levels and riding a solid uptrend.
TSLA Chart Analysis
According to TrendSpider, while the candlestick chart might look chaotic, the line chart tells a clearer story of upward movement. Recent price action and technical signals back this bullish outlook.
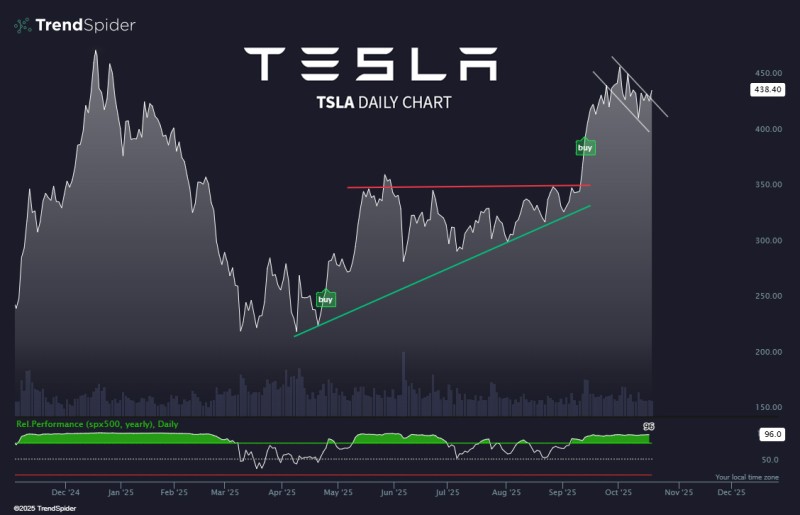
The chart reveals several compelling technical factors:
- Trendline Support: A green ascending line shows Tesla's consistent pattern of higher lows since early summer 2025
- Breakout Zone: The move above $350 triggered a technical buy signal, now validated as momentum carries prices past $430
- Consolidation Flag: A short-term downward channel forms what looks like a bull flag—typically a pause before the next leg up
- RSI Reading: At 96, the RSI shows overbought territory, though this often accompanies strong rallies
What's Driving the Rally
Tesla's climb isn't just technical. The fundamentals are lining up too. Delivery numbers came in better than Wall Street expected. The company's energy storage and AI businesses keep expanding. And there's ongoing buzz around progress in autonomous driving tech.
Traders should keep an eye on $350–360 as the new support floor after the breakout. Resistance sits at $450–460, where the current pause is happening. If Tesla breaks through convincingly, $500 becomes the next logical target.
Sure, the stock's overbought in the short term, and we might see some profit-taking. But the bigger picture still looks bullish. The line chart cuts through the day-to-day noise and shows a trend that wants to continue. The question now is whether Tesla can push past $450 and make a run at $500.
 Usman Salis


