Peter Smith

⬤ Tesla (TSLA) is testing a technically important zone around $488 that could become support if the stock pushes through. The price has been following Fibonacci levels pretty closely, with the current resistance sitting right on top of a noticeable volume shelf on the daily chart.
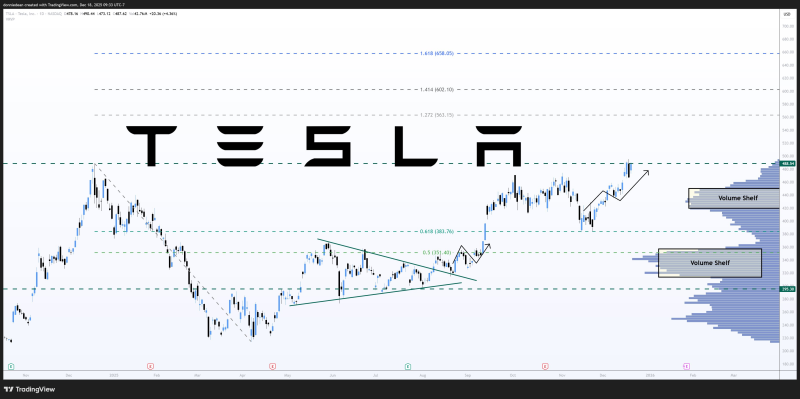
⬤ After breaking out of a long consolidation earlier this year, Tesla has been climbing through Fibonacci targets one by one. The next stops are $563.15 and $602.10—these match up with the 1.272 and 1.414 Fibonacci extensions. Volume data shows there's decent activity around these prices, which means they could either hold the stock back or catch it if there's a pullback.
⬤ What makes this move interesting is how controlled it's been. After reclaiming the $383.76 level back in the consolidation phase, TSLA kept pushing higher without giving up much ground. Whenever it pulled back, it stayed above important Fibonacci support zones, which tells you these levels actually matter to traders watching the chart.
⬤ The bigger picture target sits at $658.05—the 1.618 Fibonacci extension that technicians call the golden ratio. That's where previous highs come into play. Whether Tesla can flip this $488 resistance into support will determine if it keeps following this Fibonacci roadmap or needs more time to build strength before the next leg up.
 Peter Smith