Usman Salis

⬤ Tesla stock is hovering around $475 on the monthly chart, moving within a long-term pattern built from curved and straight trend lines. The chart shows price symmetry has been a more reliable guide than narratives that typically follow price action rather than predict it. An upward arrow on the chart points toward a higher resistance zone along the same structural curve.
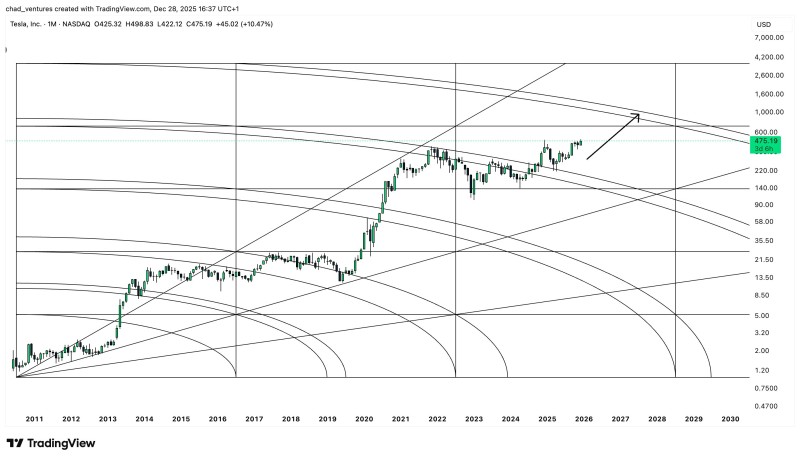
⬤ Over multiple years, Tesla has respected large-scale support and resistance arcs on the monthly timeframe. After climbing from historical lows, the stock consolidated before pushing higher again, heading back toward previous resistance zones. Recent price action stays aligned with this rising structural pathway, suggesting Tesla's behavior remains consistent with the broader geometric pattern.
⬤ The analysis emphasizes "symmetry" as the driving theme—Tesla keeps reacting at recurring technical zones instead of responding to shifting sentiment or commentary. "Those external narratives often react after the price has already moved, while the structure visible on the chart has remained consistent across cycles," the analysis notes.
⬤ Tesla remains one of the most watched names in tech and electric vehicles, and its price movements often influence broader sector sentiment. If the stock keeps following this long-term symmetry, traders might view it as confirmation of an orderly technical trend rather than emotion-driven swings. With Tesla approaching long-term resistance levels, price behavior in this zone will likely draw close attention as the monthly pattern continues unfolding.
 Usman Salis