 Saad Ullah

⬤ SOFI stock has pulled back but is now finding support at a technically crucial level. Shares are trading slightly below the 200-day moving average while holding just above a major structural support zone. The price action shows compression within a corrective channel rather than accelerating downward, which suggests selling pressure might be losing steam.
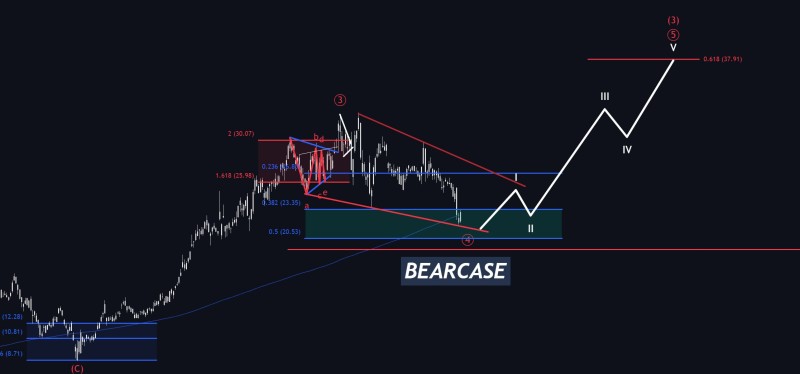
⬤ The technical setup reveals an Elliott Wave corrective phase within a larger bullish cycle. Price has moved into a confluence zone defined by Fibonacci retracement levels and horizontal support—an area that historically marks trend reversals. This pattern looks remarkably similar to what happened in April 2025, when SOFI consolidated near long-term support before launching into a strong upside move.
⬤ While the stock remains below its 200 DMA, confirming short-term weakness, it hasn't broken decisively below support. The chart shows a descending corrective structure that appears to be nearing completion, with wave patterns pointing toward a potential reversal. If price holds this support and breaks above the descending trendline, the next major move could push SOFI above $38, matching the 0.618 Fibonacci extension level.
⬤ This matters because SOFI often reflects broader sentiment toward high-growth fintech stocks. With price holding above major support while fundamentals improve, downside risk may be getting more limited. A confirmed reversal would signal momentum is shifting, though failure to defend this level could extend the pullback. SOFI is sitting at a critical junction that will likely define its next medium-term direction.
 Saad Ullah


