 Saad Ullah

⬤ SOFI is trading sideways around the mid-$20 range after climbing from recent lows. The stock hasn't flashed the momentum signal that kicked off its last big rally, so it's basically sitting tight while the market figures out what comes next. The chart shows a clear consolidation pattern — not breaking down, but not breaking out either.
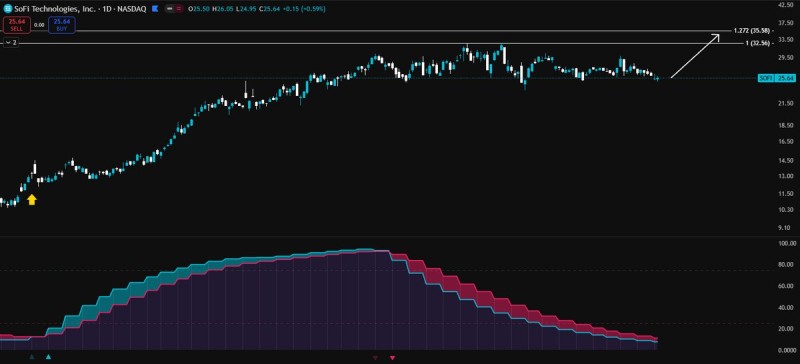
⬤ The momentum indicator is what everyone's watching right now. Last time it turned positive, SOFI went on a 130 percent tear. That's the benchmark people are using to gauge what might happen if the signal shows up again. But for now, momentum is flat, matching the sideways price action we're seeing day to day.
⬤ Technically, SOFI is still in decent shape. It's holding above support from the earlier rally and sitting just below a resistance zone. If momentum flips positive, the next target looks like the $36 area based on the chart pattern. But without that trigger, the stock is just chopping around in a range.
⬤ SOFI tends to set the tone for fintech and high-growth stocks, so what happens here matters beyond just one ticker. When a stock pauses after a strong move, it can shift sentiment across the whole sector. Whether that momentum signal finally appears or stays absent will likely influence how traders approach other volatile names that move on technicals rather than fundamentals.
 Saad Ullah


