 Marina Lyubimova

⬤ SoFi is coiling up after a monster run. The stock ripped from $10 to $25 earlier this year before settling into a tight wedge pattern in the mid-20s. Price is making lower highs and higher lows at the same time—classic squeeze territory. What makes this interesting is how similar it looks to the last setup before SOFI exploded higher.
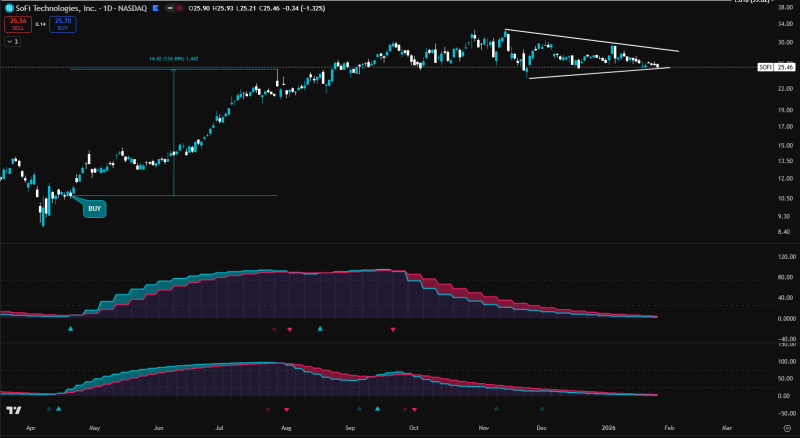
⬤ History might be rhyming here. The chart shows that the last time both momentum indicators flipped bullish together, SoFi doubled from $10 to $25. Now, after already completing that move, the stock is compressing sideways instead of collapsing. That's a good sign—it means buyers are still holding the line even as the stock takes a breather.
⬤ The indicators are almost there. Momentum has cooled off from its peak, but it hasn't rolled over. The two key gauges sitting below the price chart are inching toward another bullish signal. Price has drifted slightly lower from recent highs, but support is holding. This isn't distribution—it's digestion.
⬤ The wedge is about to crack. SOFI is running out of room inside this pattern, which means a big move is coming soon. If it breaks higher and those indicators confirm, we could see another leg up. If it breaks down, the party's over for now. Either way, SoFi is setting up for a clear directional move that could set the tone for the next few months.
 Marina Lyubimova


