Eseandre Mordi

The setup, outlined by Gabz, shows PLTR falling from around $207 to $131 - aligning with a retracement into the $125.80-$133.65 range. The move is being framed as a technical correction rather than a structural breakdown.
The PLTR Retracement That Reset the Trend
The chart shows a clear transition from an uptrend into a corrective phase. After peaking above $200, PLTR began forming lower highs and eventually broke below short-term momentum, accelerating into the current support zone.
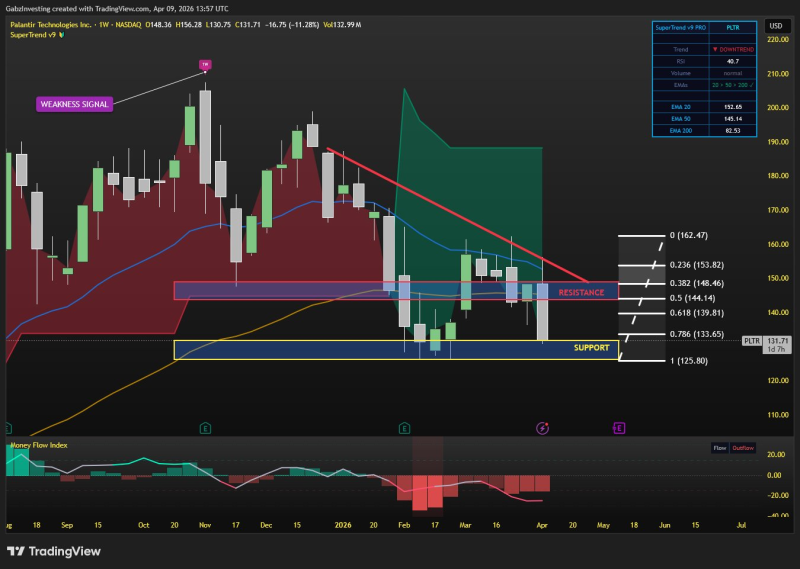
This decline closely tracks a Fibonacci retracement sequence, with price now interacting with the lower band of that structure. The move is not random - it follows a structured pullback pattern often seen after strong advances, where the depth of the correction is proportional to the speed of the prior rally.
The decline closely tracks a Fibonacci retracement sequence - a structured pullback pattern often seen after strong advances rather than a random breakdown in trend.
Palantir Bounces at 0.618 Fib, Eyes $139-$145 Resistance captured an earlier interaction with the same Fibonacci framework, showing how this level has been the defining support reference throughout PLTR's corrective phase.
Why the $125-$133 PLTR Zone Is the Focus
The chart highlights a clearly defined support range between $125.80 and $133.65, corresponding with deeper Fibonacci levels and marking the zone where buyers are expected to step in. Price is currently hovering within this band - making it a key inflection point.
Above current levels, resistance is identified between $144 and $150, forming the first barrier that must be reclaimed for momentum to shift back upward. The framework is clear:
- Support: $125.80-$133.65
- Resistance: $144-$150
- RSI: ~40.7 and falling
- MFI: outflow
Holding this region keeps the corrective structure intact, while a breakdown would shift focus toward deeper downside scenarios.
PLTR Momentum Weakens, but Structure Holds
Short-term indicators reflect pressure. RSI near 40.7 and trending lower, alongside MFI indicating outflows, are both consistent with a market still in correction mode. However, the broader structure remains constructive.
The EMA stack is still aligned with 20 above 50 and 50 above 200 - the longer-term trend has not fully broken despite the sharp pullback from highs.
The EMA stack is still aligned with the 20 above the 50 and the 50 above the 200, indicating that the longer-term trend has not fully broken. The 200 EMA positioned far below near $82 reinforces how extended the prior rally was - and how much room remains before the long-term trend is genuinely threatened.
Palantir Reclaims 50-Week MA at $151, Eyes $166-$171 Breakout Zone captured PLTR's structure at a higher level, showing how quickly the technical picture can shift once key moving averages are reclaimed - and why the current support test matters for determining whether that kind of recovery is still possible from here.
Palantir Stock May Drop Below $100 Before Finding Support outlines the downside scenario if the $125-$133 zone fails to hold - a reminder that the current support test is not just a buying opportunity but a genuine decision point for the broader trend structure.
 Eseandre Mordi