 Artem Voloskovets
Oracle Corporation (NYSE: ORCL) is catching traders' eyes after some choppy sessions. The stock's been grinding sideways, but technical indicators are starting to hint at a possible bullish setup.
What the Chart Shows
Trading around the $305 mark, ORCL just flashed a fresh UltraBuy signal near support, according to UltraAlgo™. That's got people wondering if we're about to see a bounce.
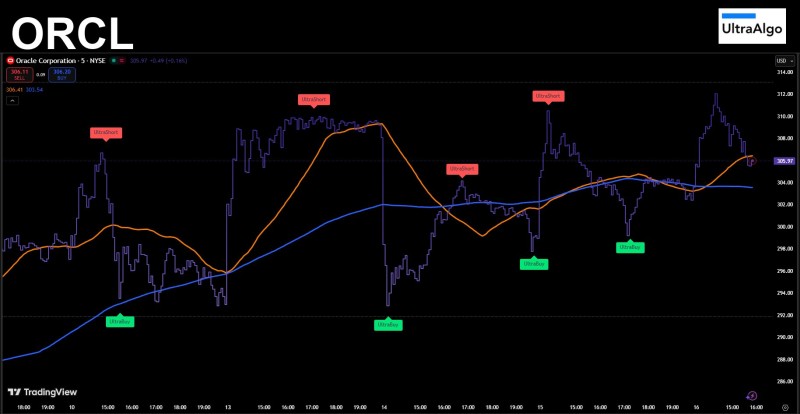
Looking at the 5-minute chart, you can see ORCL's been in a real back-and-forth between buyers and sellers. Multiple UltraShort and UltraBuy signals have fired off recently, showing how contested this price zone is. Right now, the stock's camping out around $305–306, which has been acting as a floor.
The UltraBuy popped up just as the stock lifted off its intraday lows. The orange moving average is starting to curl up a bit, while the longer-term blue line is flattening out—basically saying things might be stabilizing. But there's still resistance sitting overhead near $312, right where we saw those earlier UltraShort signals and selling pressure.
Key Levels to Watch
- Support: $303–305 is the zone to hold
- Resistance: $310–312 is where sellers have been waiting
- Bullish confirmation: Need to see price push and hold above the short-term moving average
- Risk alert: A drop below $303 would likely invalidate the UltraBuy signal and could open the door to more downside
Why This Matters
Oracle's been consolidating after running up earlier this quarter. With the company's cloud and AI business driving the fundamental story, traders are leaning heavily on technicals right now to time their entries. This UltraBuy signal suggests there might be some short-term buying pressure building, but it'll need follow-through above that resistance zone to really mean something. Without that confirmation, it's just another signal in a rangy market.
 Artem Voloskovets


