 Saad Ullah

⬤ Oracle appears to be finding its footing after a prolonged downturn, with fresh technical signals pointing toward possible stabilization. The stock is currently trading around $204.96 on the daily chart, bouncing slightly after dipping below its 200-day moving average. Recent AI-generated forecasts show a potential upward trajectory from these levels, marking what could be an important turning point for the tech giant.
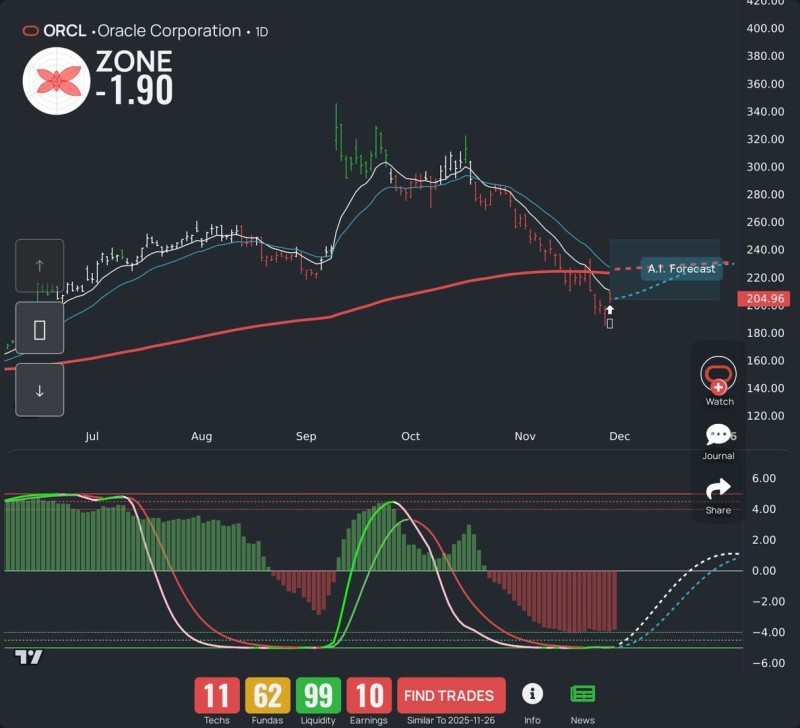
⬤ The November selloff pushed ORCL sharply lower before support kicked in and triggered a small reversal pattern. AI forecasting tools now project a gradual recovery path over the coming sessions if buying momentum continues building. The LEAF Zone score sits at –1.90, reflecting recent downside pressure, though the stock is attempting to climb back into its previous trading range. Both fast and slow moving averages still sit above current price levels, but the latest candle shows renewed buyer interest.
⬤ Momentum indicators reveal interesting shifts beneath the surface. The histogram is transitioning from deep red to lighter shades, while signal curves are beginning to curl upward – typically signs of early momentum recovery. Forecast curves project this upward bias may continue if the pattern holds. The technical setup combines algorithmic indicators, mean-reversion dynamics, and long-term support levels at a critical junction.
⬤ What happens next at this AI-flagged setup matters significantly for Oracle's near-term direction. If the stock builds on its current bounce and aligns with positive forecasts, sentiment could shift and stability may return after the extended decline. However, failing to maintain momentum would confirm the negative zone reading and keep downward pressure intact. Traders are watching closely to see whether Oracle can capitalize on this technical opportunity.
 Saad Ullah


