 Usman Salis
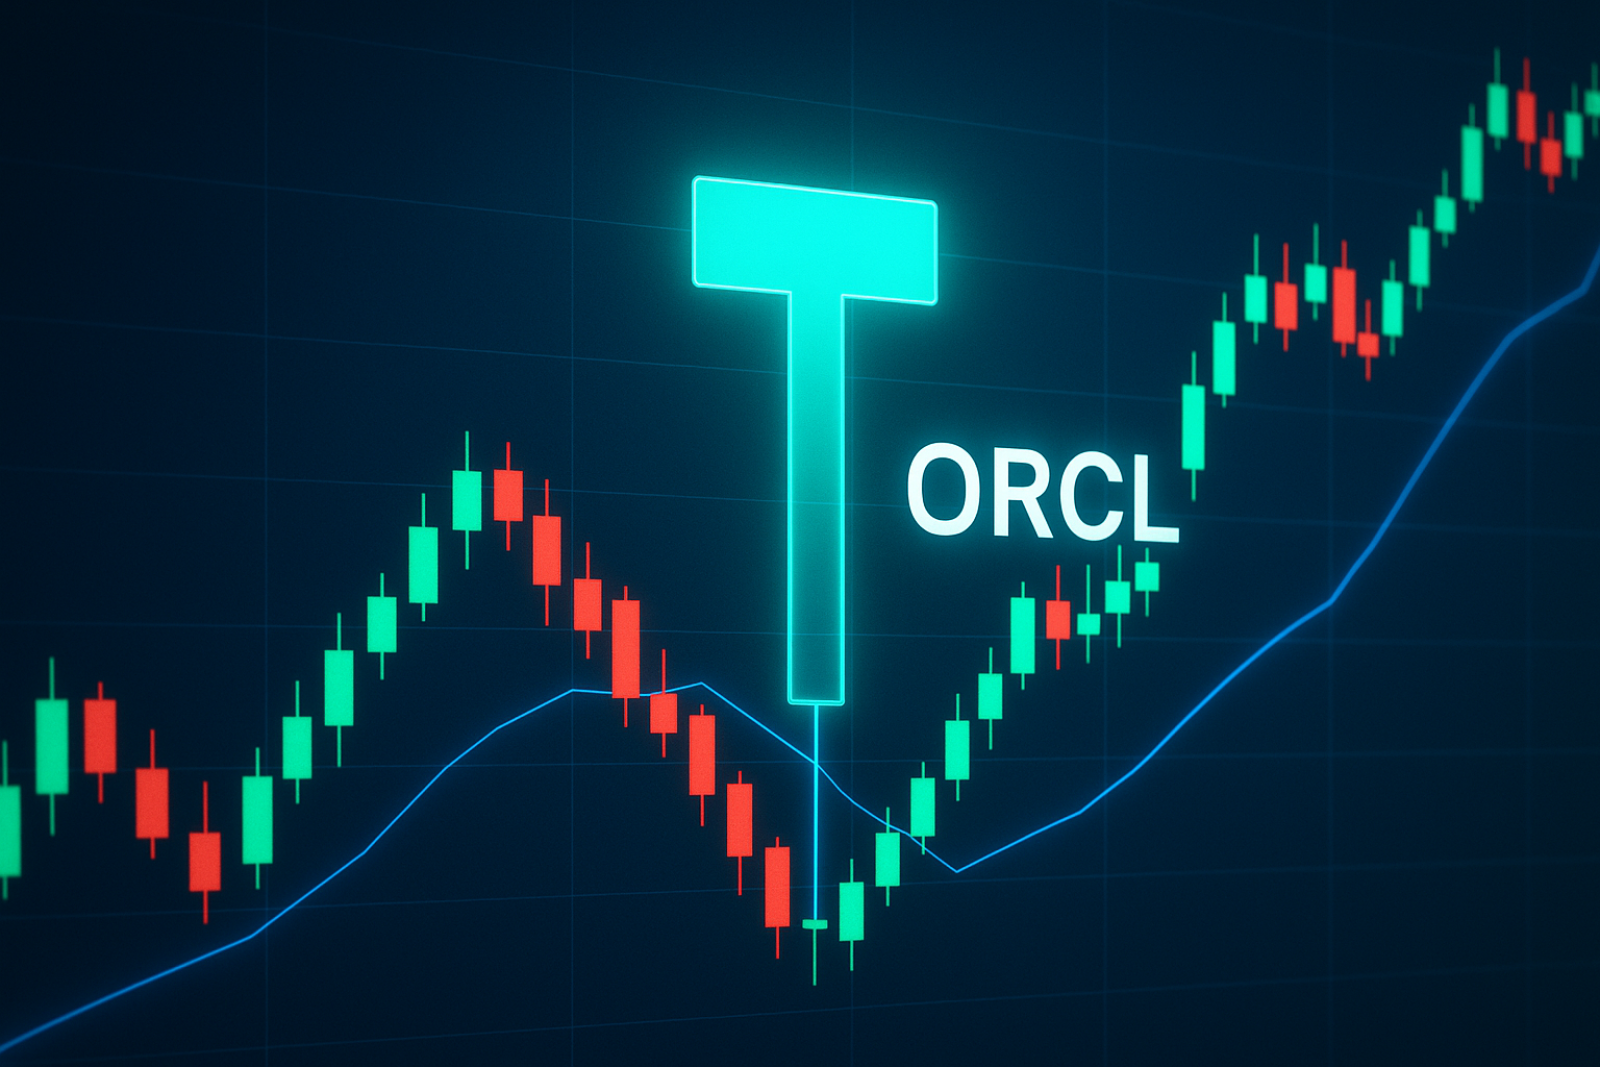
⬤ ORCL formed a hammer candle on its daily chart, signaling a potential momentum shift after weeks of steady decline. The hammer emerged as ORCL touched a wide support zone, with the price recovering to around $196 after dipping lower during the session. The long lower wick shows strong buying activity late in the day, creating the first positive signal in several weeks.
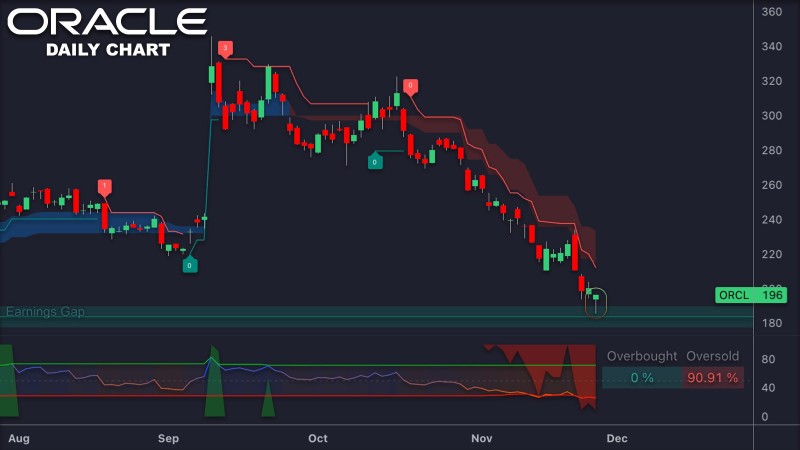
⬤ The chart reveals ORCL in a clear downtrend that started in late September, trading below a red resistance cloud that's been guiding the bearish structure. Multiple sell markers throughout October and November highlight sustained weakness. The hammer now stands out as ORCL retests a major area linked to an earlier earnings gap. With the stock settling above this support region, the candle shows a meaningful reaction after persistent selling pressure.
⬤ Indicator readings show oversold conditions at 90.91%, pointing to deeply stretched conditions before the bounce. The mix of an extended downtrend, heavy oversold readings, and a hammer at a historically reactive zone makes this price level particularly important. The highlighted circle on the chart marks where buyers stepped in to defend an area tied to previous trading activity.
⬤ This matters because hammer patterns at major support zones often signal short-term momentum changes that can impact broader market behavior. With ORCL responding to a structurally key level and showing strong intraday recovery, the chart captures a moment where sentiment might start shifting after weeks of decline. How the stock performs in the next few sessions will determine whether the hammer marks the start of stabilization or just a temporary pause in the downtrend.
 Usman Salis


