 Usman Salis

⬤ Oracle has almost completed another gap fill, sliding steadily toward a key technical level on the daily chart. The stock is now trading around $227, continuing a multi-week decline that started in late September when it reversed from resistance above $300.
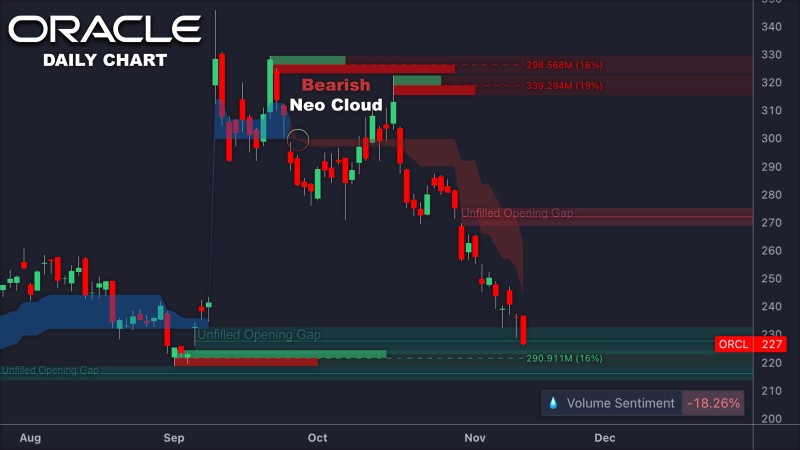
⬤ The chart shows a Bearish Neo Cloud formation dominating the structure, signaling ongoing downside pressure with resistance spanning $298–$339. As Oracle drops deeper, it's closing in on an unfilled opening gap between $220 and $230—an area that typically acts as short-term support after prolonged declines. Technical traders see this as the likely completion of a full gap fill cycle, where price retraces into prior liquidity gaps before potentially stabilizing.
⬤ While filling a gap can sometimes spark short-term bounces, the broader trend remains negative. Volume sentiment is down 18.26%, showing weak demand and continued bearish control. A failure to hold above $220 could open the door to further losses toward $210 or lower. Beyond the technicals, Oracle is also dealing with tightening enterprise IT budgets and investor focus shifting toward AI-driven growth stocks that are pulling attention and capital away.
⬤ The gap fill pattern points to a "mature phase" of Oracle's ongoing correction. While the gap is nearly closed, there's no clear reversal signal yet. Until volume sentiment picks up and the stock breaks above the bearish cloud, caution is warranted. The next few sessions will reveal whether this gap fill acts as a support base—or just a brief pause before more downside heading into December.
 Usman Salis


