Alex Dudov

Nvidia (NVDA) is slipping back to mid-October levels after a strong rally pushed it above $210 just days ago. The chart shows a clear shift: after an impressive climb, NVDA is now printing consecutive red candles — suggesting more than just a routine pause.
NVDA Retreats Sharply as Sellers Take Control
Analysts from Barchart drew attention to the move, pointing out that NVDA has pulled back significantly from its recent highs. The daily chart shows a reversal unfolding after touching the $210–$212 area at the end of October.
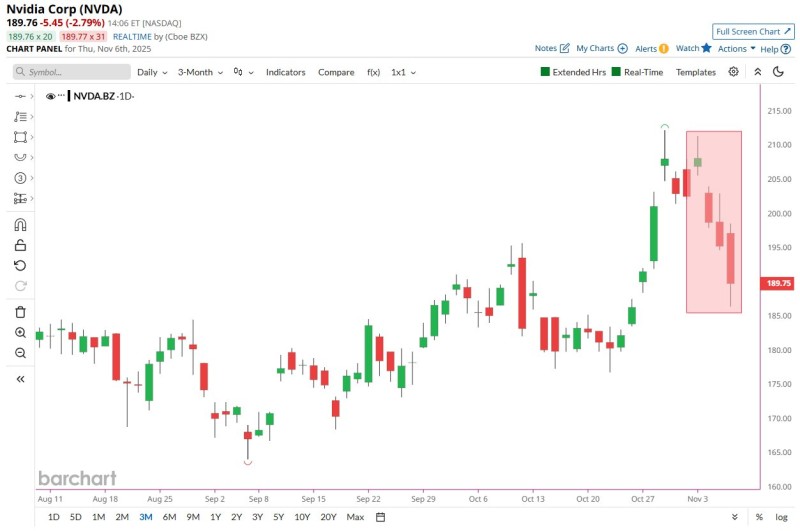
A strong reversal candle appeared near the peak, followed by four consecutive red candles showing persistent selling. NVDA has now declined to around $189–$190, returning to levels from roughly two weeks earlier. The size and consistency of the candles suggest a meaningful shift in sentiment after an extended rally.
Key Technical Levels to Watch
Several price zones matter for traders:
- Immediate Support: $185–$188 — October consolidation base that could attract dip buyers
- Secondary Support: $178–$180 — Well-tested level from September
- Overhead Resistance: $204–$210 — Where the reversal first took shape
NVDA is moving downward but remains above key medium-term supports.
Why Nvidia Is Pulling Back Now
Several factors explain the decline. Profit-taking after a sharp run-up is one obvious reason — NVDA rallied aggressively into late October, and traders often secure gains near recent highs. Market rotation across tech stocks has also increased volatility as interest-rate expectations shift. On top of that, the AI sector is recalibrating. Although Nvidia remains the top AI chip supplier, elevated expectations for the next earnings cycle make the stock sensitive to momentum changes.
 Alex Dudov