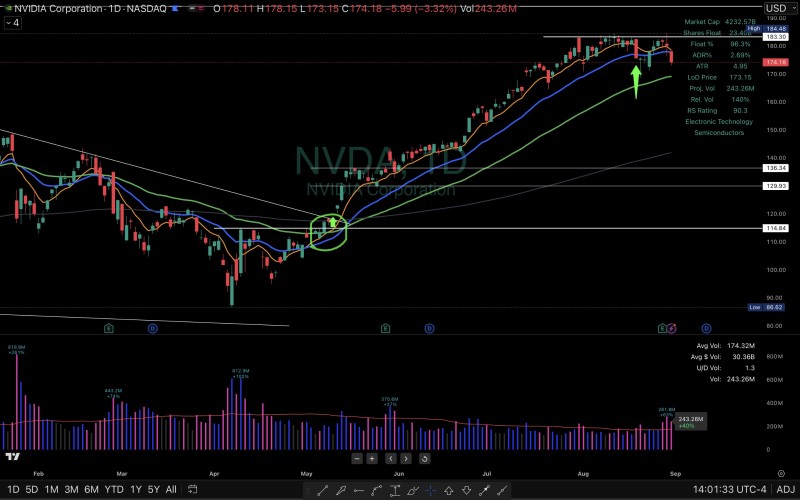
NVIDIA has been a standout performer in tech this year, but recent price action suggests the party might be cooling off. The stock just dropped below its 21-day exponential moving average (EMA), officially ending a swing trade that ran for nearly four months.
This moving average had been a reliable support during NVDA's climb, making its breach a noteworthy technical event. Traders who relied on the EMA crossover system got both their entry signal months ago and now their exit warning.
NVDA Price Breaches 21 EMA Support
Trader @1ChartMaster emphasized how the NVDA closed at $174.18, falling below the 21 EMA that had been holding as support. This breakdown marks the end of the swing trade that began in late spring when the stock first gained bullish momentum.

The recent rally peaked at $184.48, but momentum has clearly shifted. With the average true range sitting at 4.95 and daily volume exceeding 243 million shares, volatility is picking up—a sign that bigger moves could be coming.
Key NVDA Support and Resistance Zones
Support levels to watch:
- $173.15 (today's low)
- $170.32 (50-day EMA)
- $164-158 (volume gap zone where selling could accelerate)
Resistance levels:
- $177-178 (bounce target)
- $184.48 (recent high and major resistance)
If NVDA can't hold above the 50-day EMA around $170, there's a notable volume gap that could send the stock tumbling toward $158 quickly.
This EMA breakdown is a short-term bearish signal, but NVDA's fundamentals remain solid. With a $4.23 trillion market cap, a relative strength rating of 90.3, and continued institutional backing, the company stays a semiconductor leader.
Bulls need to see NVDA reclaim $177 to validate any bounce attempt. Until that happens, the chart suggests playing it safe—either a consolidation phase or deeper pullback looks possible from here.
 Peter Smith

 Peter Smith


