 Usman Salis

⬤ NVDA is displaying significant changes in its long-term chart structure, with a broadening pattern now visible on the weekly timeframe. The price action shows expanding volatility through higher highs and lower lows, creating a widening range. This pattern appeared after years of steady gains, marking a shift from orderly uptrends to something more unstable.
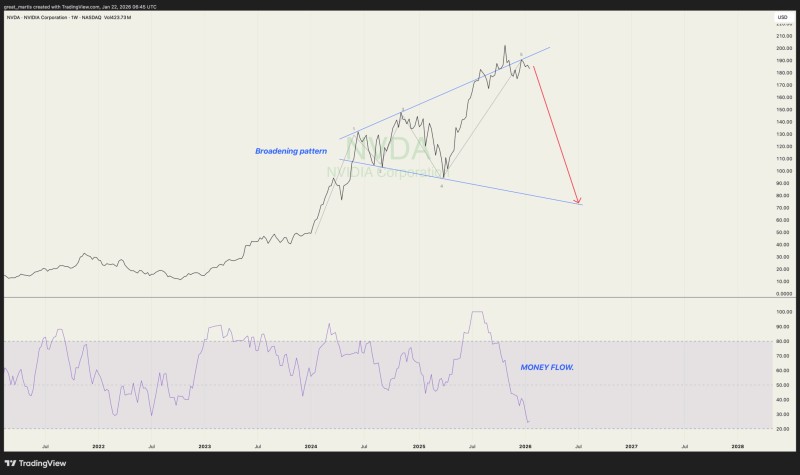
⬤ The chart shows Nvidia hitting the upper edge of this broadening formation before losing steam. Price has started rolling over from elevated levels, with potential downside toward the pattern's lower trendline. Broadening patterns typically signal growing disagreement between buyers and sellers, where pressure swings back and forth with increasing force. This usually happens late in a cycle rather than during healthy trend continuation.
⬤ The most concerning element is the money flow indicator, which has turned sharply lower. It's showing a steep decline from previously high readings, pointing to reduced capital inflows and rising distribution activity. This money flow deterioration conflicts with the earlier price strength, suggesting demand is weakening underneath. When money flow contracts while price stays relatively elevated, it often means buyer conviction is fading rather than the stock just consolidating normally.
⬤ These technical shifts matter because Nvidia has been driving much of the recent market leadership, especially in tech and semiconductor sectors. A structural change in NVDA's chart can ripple through broader market sentiment given its massive influence. The broadening pattern combined with weakening money flow creates a more fragile setup where volatility and downside risk could jump if selling accelerates. Right now, traders should watch this zone carefully as technical conditions evolve.
 Usman Salis


