Peter Smith

A notable shift is unfolding for NIO Inc. as price breaks above $5.30 and successfully holds that level on a retest. As Fibby. noted, this type of breakout-and-hold behavior has not been seen in a long time - making the current setup particularly important for NIO stock.
The NIO Level That Flipped the Structure
The chart shows a prolonged downtrend marked by lower highs and repeated rejections near the $7.71 resistance zone. Price consistently failed in that region, reinforcing it as a strong ceiling.
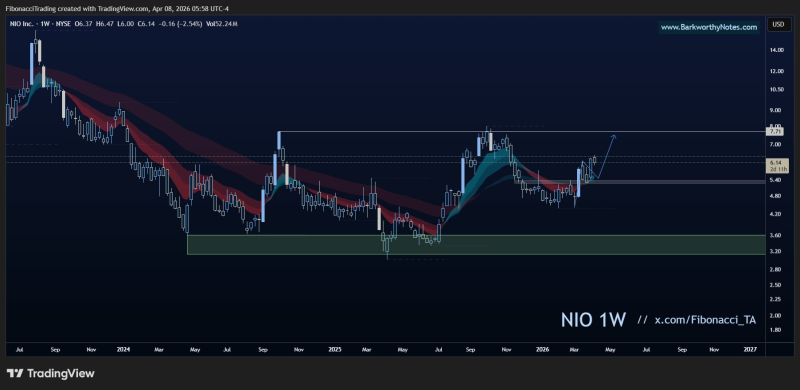
That structure begins to shift once NIO moves above $5.30. This level, previously acting as resistance, is now being tested as support - and so far, it is holding. This transition is central to the current setup and represents the first meaningful structural change the weekly chart has shown in a significant period of time.
NIO Stock Price Breaking Above $5.49 Could Confirm Trend Re-Establishment outlined the significance of clearing this general price region before the current move developed, showing how closely the market had been watching this zone as a potential inflection point.
Holding $5.30 Keeps the NIO Setup Intact
Price is currently stabilizing above the $5.30 zone, maintaining the structure highlighted in the source. As long as NIO stock holds above this area, the breakout remains valid. Losing this level would weaken the setup - but continued support keeps the bullish structure in play and the next target in view.
NIO Stock Targets $8 as Structure Strengthens Around Key Fibonacci Levels maps the Fibonacci framework that gives the $5.30 and $7.71 levels their technical significance - showing how these are not arbitrary price points but zones with measurable structural weight across multiple timeframes.
NIO's Next Test Sits at $7.71 Resistance
Above current price, the next major level is clearly defined near $7.71. This zone has acted as resistance multiple times on the chart and remains the key ceiling for any sustained recovery. The progression outlined in the setup is straightforward: hold $5.30, then move toward $7.71 - and the chart supports that structure with the resistance band visibly capping prior advances.
NIO Stock Price Analysis: NIO Targets $8.20 as Weekly Base Forms extends the upside projection beyond $7.71, showing what the structure looks like if NIO can clear that resistance with conviction and whether the weekly base now forming is substantial enough to support a move toward higher levels.
If price reaches the $7.71 area again, it will test whether the broader structure can shift beyond recovery into a stronger upward move - and whether the rare bullish weekly behavior now visible can translate into something more sustained.
 Peter Smith