 Eseandre Mordi

⬤ NIO is back on traders' radar after a TradingView chart laid out a bullish Wave 3 scenario anchored to the 200-day moving average. The snapshot shows NIO closing around $5.29, up roughly 4.34% on the day, while the SMA (200, close) sits near $5.22. That narrow gap above the long-term trend line is being read as technical confirmation that a new upward phase is underway. According to the analysis, NIO reclaiming the $5 level with $5.19 as the next key breakout area fits naturally into this broader wave structure.
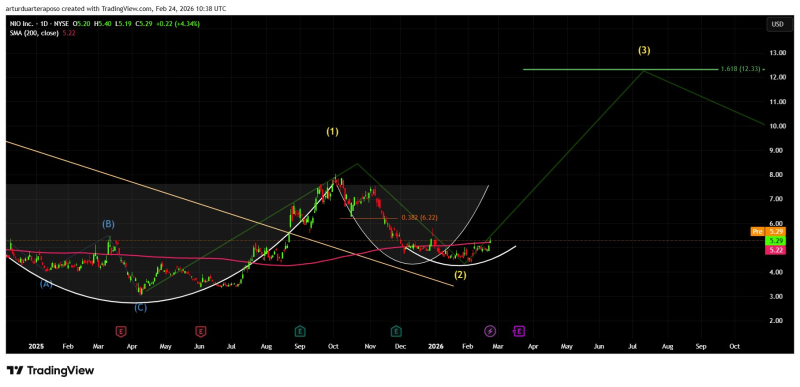
⬤ The chart frames current price action as a continuation following a base-building Wave 2 phase. The first leg of the projected move targets $8 in a steady, gradual climb rather than a sharp spike. As the chart commentary puts it, faster price action may come closer to earnings as profitability expectations grow louder. Traders watching NIO above $5.40 as a signal for a bullish shift would see that level as an early checkpoint in this sequence.
The initial phase is expected to develop steadily - not as an immediate vertical breakout.
⬤ A Fibonacci extension at 1.618 lands at $12.33, aligning with the stated Wave 3 target near $12. The chart also marks an intermediate 0.382 level at $6.22, giving a roadmap for how the move might unfold step by step. Earlier analysis had already flagged this kind of potential, with NIO turning bullish at $4.93 with a 72% upside target before earnings, which ties directly to the $8 first leg outlined here.
⬤ The 200-day moving average carries real weight in technical analysis - sustained trade above it typically signals a shift from recovery mode to trend continuation. As long as NIO holds above this level, the wave count keeps $8 as the next major waypoint and $12 as the broader objective. The coming sessions will be key in confirming whether this breakout structure holds up under pressure.
 Eseandre Mordi


