Usman Salis
⬤ NIO stock has been sliding lower recently, getting closer to the $5.51 level that's been on traders' radar. The shares were trading near $5.77, moving in line with the anticipated pullback toward this important support area. This price point sits at a key technical level within the current wave structure.
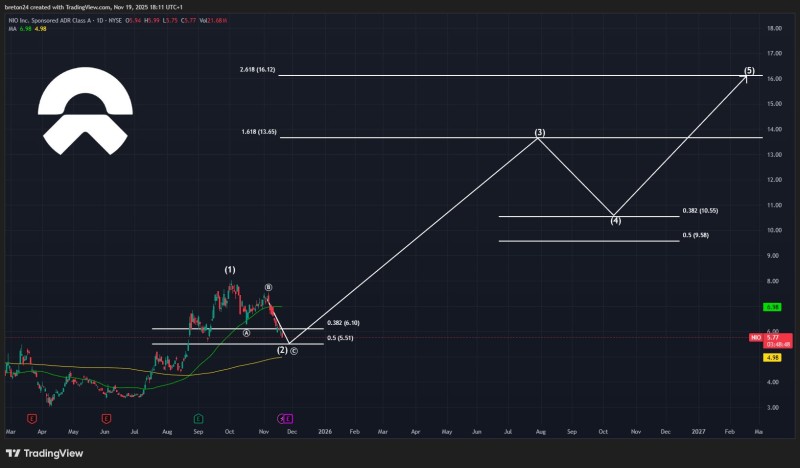
⬤ The technical setup shows NIO developing a multi-step corrective pattern. Key Fibonacci levels include the 0.382 retracement at $6.10 and the deeper 0.5 level at $5.51, which aligns with expectations that the price could test this lower boundary before finding stability. If this corrective phase plays out as mapped, the long-term projection points to potential upside targets around $13.65 and $16.12 once the current cycle finishes.
⬤ Despite the recent weakness, some traders are holding onto substantial gains from earlier positions, with returns around 35 percent still intact. The longer-term outlook remains optimistic, with a multi-year roadmap suggesting a significant advance could follow once the correction wraps up. The wave structure indicates that a reaction near $5.51 could mark a turning point in the broader trend.
⬤ The $5.51 level matters because it represents major structural support that could shape momentum going forward. If this zone holds as expected, it might provide the launching pad for the next leg higher shown in the long-term projections. These inflection points often draw attention from market participants since they can signal whether the current trend will strengthen or start to reverse.
 Usman Salis