Peter Smith

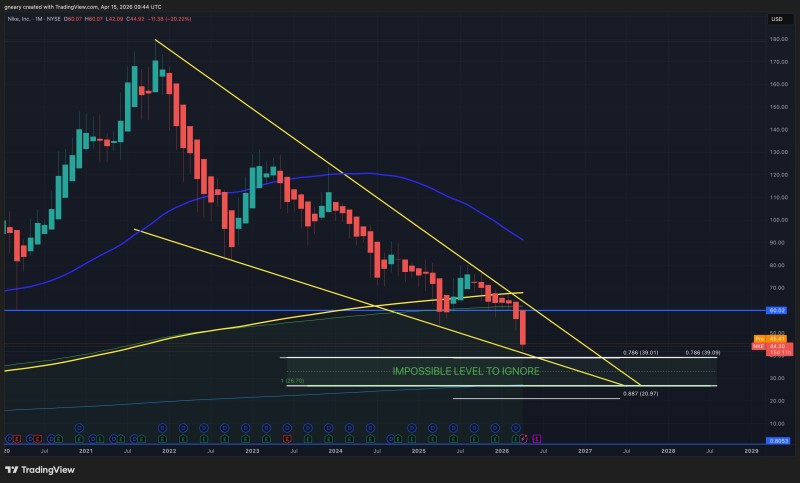
Nike stock has been grinding lower for months, and the latest price action brings it within striking distance of a critical support zone near $39. According to The Long Investor, this area represents an "impossible level to ignore" as price continues to approach it from above. The chart tells a familiar story at this point: a steady sequence of lower highs and lower lows, all contained within a descending structure that has shown no signs of breaking.
There have been no shortage of attempts to recover. Each time buyers stepped in, the rally ran straight into the upper boundary of the descending formation and rolled over. Sellers have been consistent in their control, and nothing in the current structure suggests that dynamic is changing anytime soon.
This area is an impossible level to ignore as price approaches it.
Nike Stock Has Lost the $60 Level and Isn't Getting It Back
One of the clearest signals of how far sentiment has shifted is what happened at the $60 zone. That level used to function as solid support, a floor that buyers defended reliably. Then it broke. And once it broke, Nike stock drops after weak outlook showed just how quickly momentum can flip - price couldn't reclaim it, and the failed retest confirmed it had converted into resistance.
This pattern shows up across markets regularly. Former support, once lost, tends to become a ceiling that accelerates the move lower rather than slowing it. Nike's price action since that breakdown has followed that script closely - no higher highs, no structural repair, just continued compression.
The trend remains dominant, and until price shows a clear shift in structure, the downward trajectory continues to guide expectations.
Nike Stock Downtrend: $39 Is the Next Level That Matters
With the $60 level behind it, attention has shifted to the next visible landmark on the chart. The $39 zone now sits directly in the path of the current move, and it's attracting attention for a straightforward reason: it's the next identifiable area where price has any historical reason to slow down.
Key structural observations from the current setup:
- Price continues to follow a clear sequence of lower highs
- The descending trend remains intact without interruption
- The $60 level has already failed and is no longer supporting price
- The $39 zone is the next major area identified on the chart
Nike's current setup is defined by continuation rather than reversal - the chart shows a steady progression lower, with price approaching a zone that could attract attention but has not yet been tested.
No Reversal Signal Yet - Just a Market Still Looking for a Floor
It's worth being clear about what $39 does and doesn't represent. It's not a confirmed reversal point. There are no bullish signals forming there yet - no base, no volume pattern, no structural shift. It's simply the next area on the chart where price may pause, react, or consolidate before the broader trend decides what to do next.
Until the structure actually breaks - meaning higher highs begin to form and the descending formation gives way - the default assumption remains that the trend in control continues. Nike's chart is a study in patience for anyone waiting on the long side. The downward trajectory has been relentless, and the burden of proof sits firmly with the bulls.
 Peter Smith